EX-99.2 EARNINGS PRESENTATION
Published on February 3, 2021
© 2021 Novelis NOVELIS Q3 FISCAL YEAR 2021 EARNINGS CONFERENCE CALL February 3, 2021 Steve Fisher President and Chief Executive Officer Dev Ahuja Senior Vice President and Chief Financial Officer Exhibit 99.2
© 2021 Novelis SAFE HARBOR STATEMENT Forward-looking statements Statements made in this presentation which describe Novelis' intentions, expectations, beliefs or predictions may be forward- looking statements within the meaning of securities laws. Forward-looking statements include statements preceded by, followed by, or including the words "believes," "expects," "anticipates," "plans," "estimates," "projects," "forecasts," or similar expressions. Examples of forward looking statements in this presentation are statements about our expectations fend market demand in 2021. Novelis cautions that, by their nature, forward-looking statements involve risk and uncertainty and Novelis' actual results could differ materially from those expressed or implied in such statements. We do not intend, and we disclaim any obligation, to update any forward-looking statements, whether as a result of new information, future events or otherwise. Factors that could cause actual results or outcomes to differ from the results expressed or implied by forward-looking statements include, among other things: changes in the prices and availability of aluminum (or premiums associated with such prices) or other materials and raw materials we use; the capacity and effectiveness of our hedging activities; relationships with, and financial and operating conditions of, our customers, suppliers and other stakeholders; fluctuations in the supply of, and prices for, energy in the areas in which we maintain production facilities; our ability to access financing including in connection with potential acquisitions and investments; risks relating to, and our ability to consummate, pending and future acquisitions, investments or divestitures; changes in the relative values of various currencies and the effectiveness of our currency hedging activities; factors affecting our operations, such as litigation, environmental remediation and clean-up costs, labor relations and negotiations; breakdown of equipment and other events; economic, regulatory and political factors within the countries in which we operate or sell our products, including changes in duties or tariffs; competition from other aluminum rolled products producers as well as from substitute materials such as steel, glass, plastic and composite materials; changes in general economic conditions including deterioration in the global economy; the risks of pandemics or other public health emergencies, including the continued spread and impact of, and the governmental and third-party responses to risks arising out of our acquisition of Aleris Corporation including risks inherent in the acquisition method of accounting; disruption to our global aluminum production and supply chain as a result of COVID-19; changes in government regulations, particularly those affecting taxes, derivative instruments, environmental, health or safety compliance; changes in interest rates that have the effect of increasing the amounts we pay under our credit facilities and other financing agreements; and our ability to generate cash. The above list of factors is not exhaustive. Other important risk factors are included under the caption "Risk Factors" in our Annual Report on Form 10-K for the fiscal year ended March 31, 2020. 2
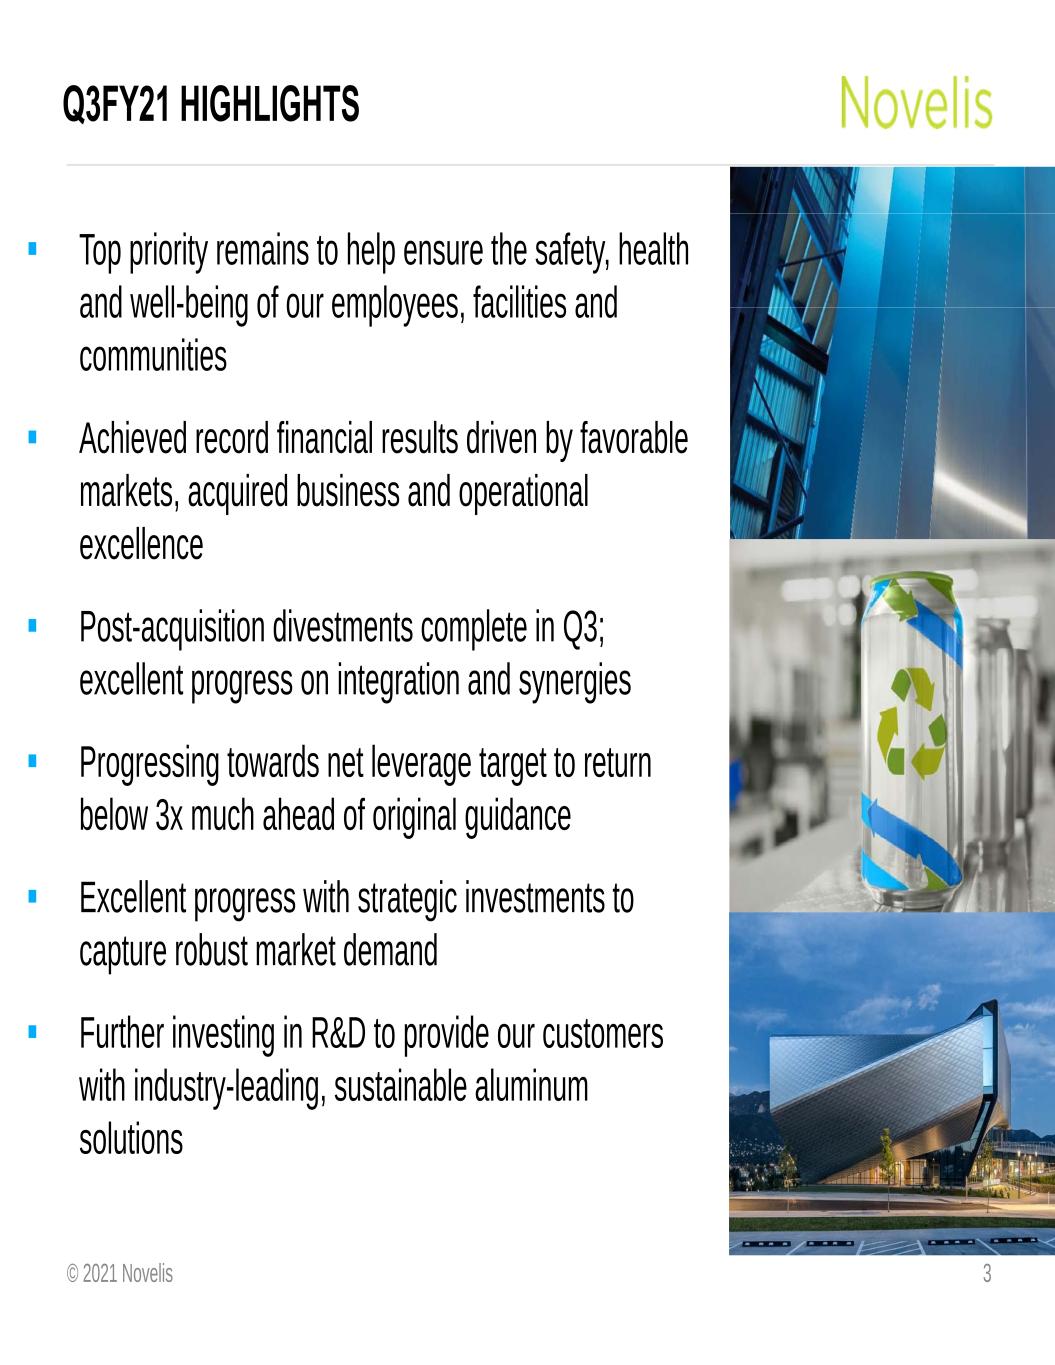
© 2021 Novelis Q3FY21 HIGHLIGHTS Top priority remains to help ensure the safety, health and well-being of our employees, facilities and communities Achieved record financial results driven by favorable markets, acquired business and operational excellence Post-acquisition divestments complete in Q3; excellent progress on integration and synergies Progressing towards net leverage target to return below 3x much ahead of original guidance Excellent progress with strategic investments to capture robust market demand Further investing in R&D to provide our customers with industry-leading, sustainable aluminum solutions 3
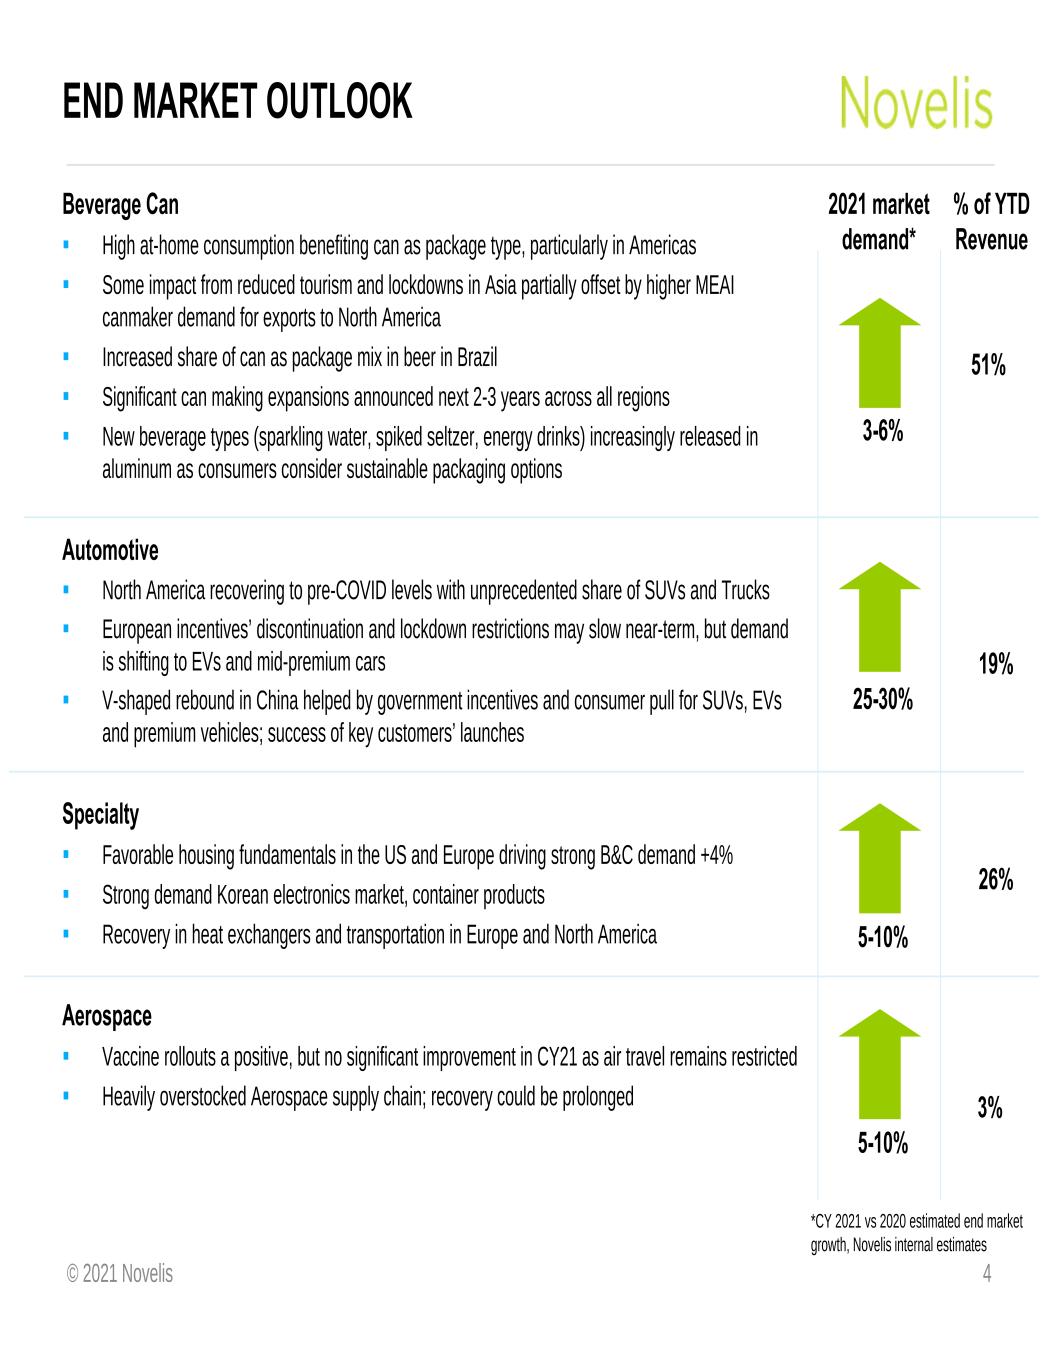
© 2021 Novelis END MARKET OUTLOOK 4 Beverage Can High at-home consumption benefiting can as package type, particularly in Americas Some impact from reduced tourism and lockdowns in Asia partially offset by higher MEAI canmaker demand for exports to North America Increased share of can as package mix in beer in Brazil Significant can making expansions announced next 2-3 years across all regions New beverage types (sparkling water, spiked seltzer, energy drinks) increasingly released in aluminum as consumers consider sustainable packaging options Automotive North America recovering to pre-COVID levels with unprecedented share of SUVs and Trucks European incentives’ discontinuation and lockdown restrictions may slow near-term, but demand is shifting to EVs and mid-premium cars V-shaped rebound in China helped by government incentives and consumer pull for SUVs, EVs and premium vehicles; success of key customers’ launches Specialty Favorable housing fundamentals in the US and Europe driving strong B&C demand +4% Strong demand Korean electronics market, container products Recovery in heat exchangers and transportation in Europe and North America Aerospace Vaccine rollouts a positive, but no significant improvement in CY21 as air travel remains restricted Heavily overstocked Aerospace supply chain; recovery could be prolonged 2021 market demand* % of YTD Revenue 51% 26% 19% 3% *CY 2021 vs 2020 estimated end market growth, Novelis internal estimates 3-6% 5-10% 5-10% 25-30%
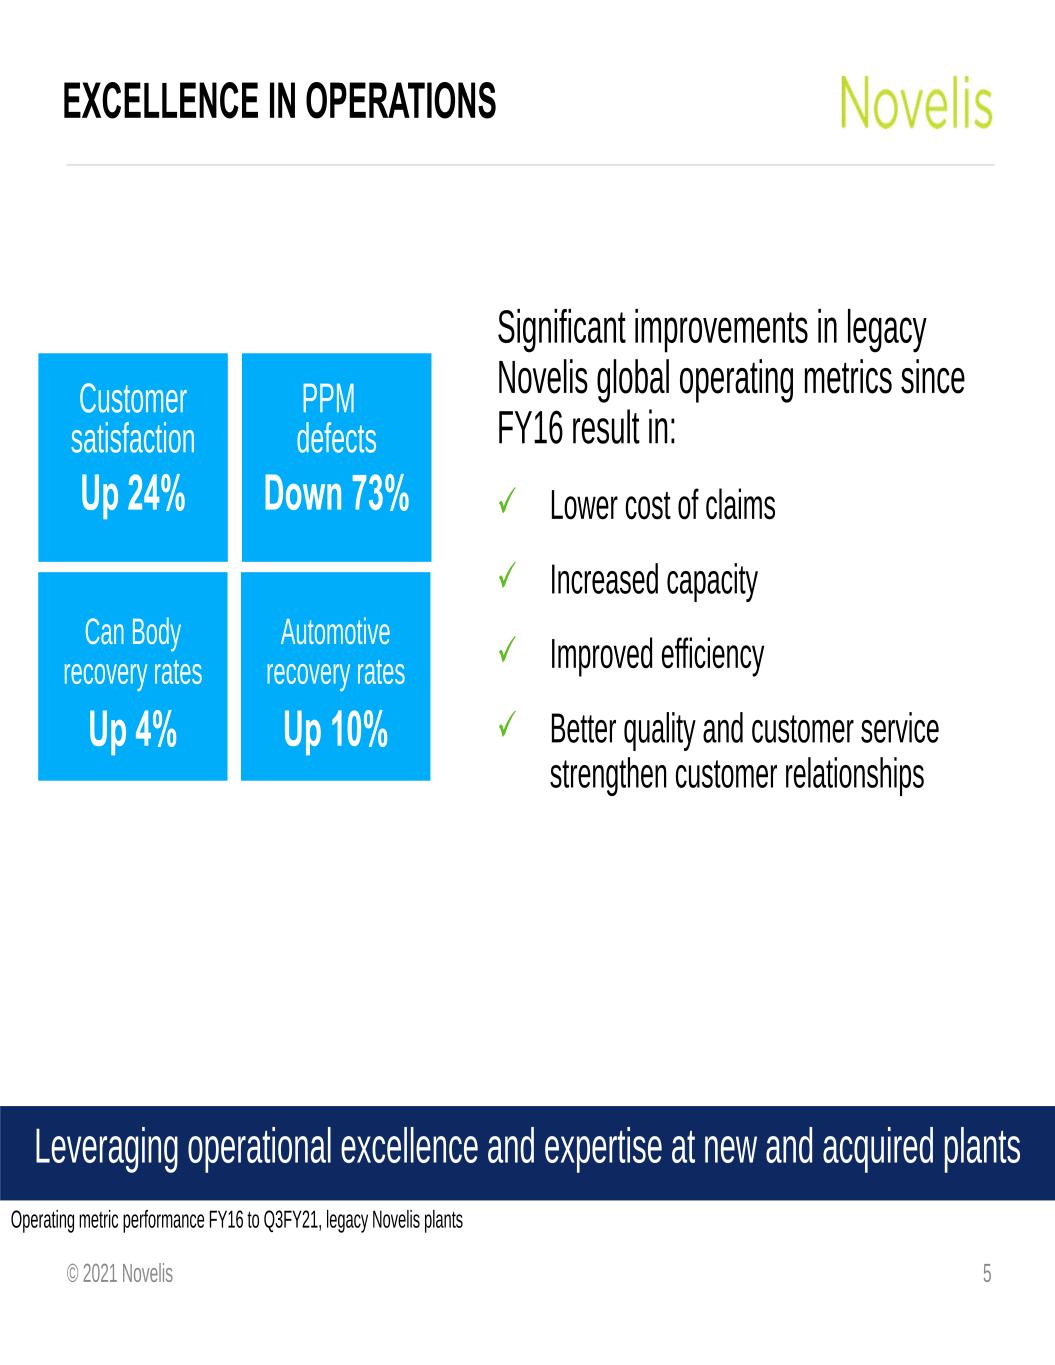
© 2021 Novelis EXCELLENCE IN OPERATIONS 5 Significant improvements in legacy Novelis global operating metrics since FY16 result in: Lower cost of claims Increased capacity Improved efficiency Better quality and customer service strengthen customer relationships Customer satisfaction Up 24% PPM defects Down 73% Can Body recovery rates Up 4% Leveraging operational excellence and expertise at new and acquired plants Operating metric performance FY16 to Q3FY21, legacy Novelis plants Automotive recovery rates Up 10%
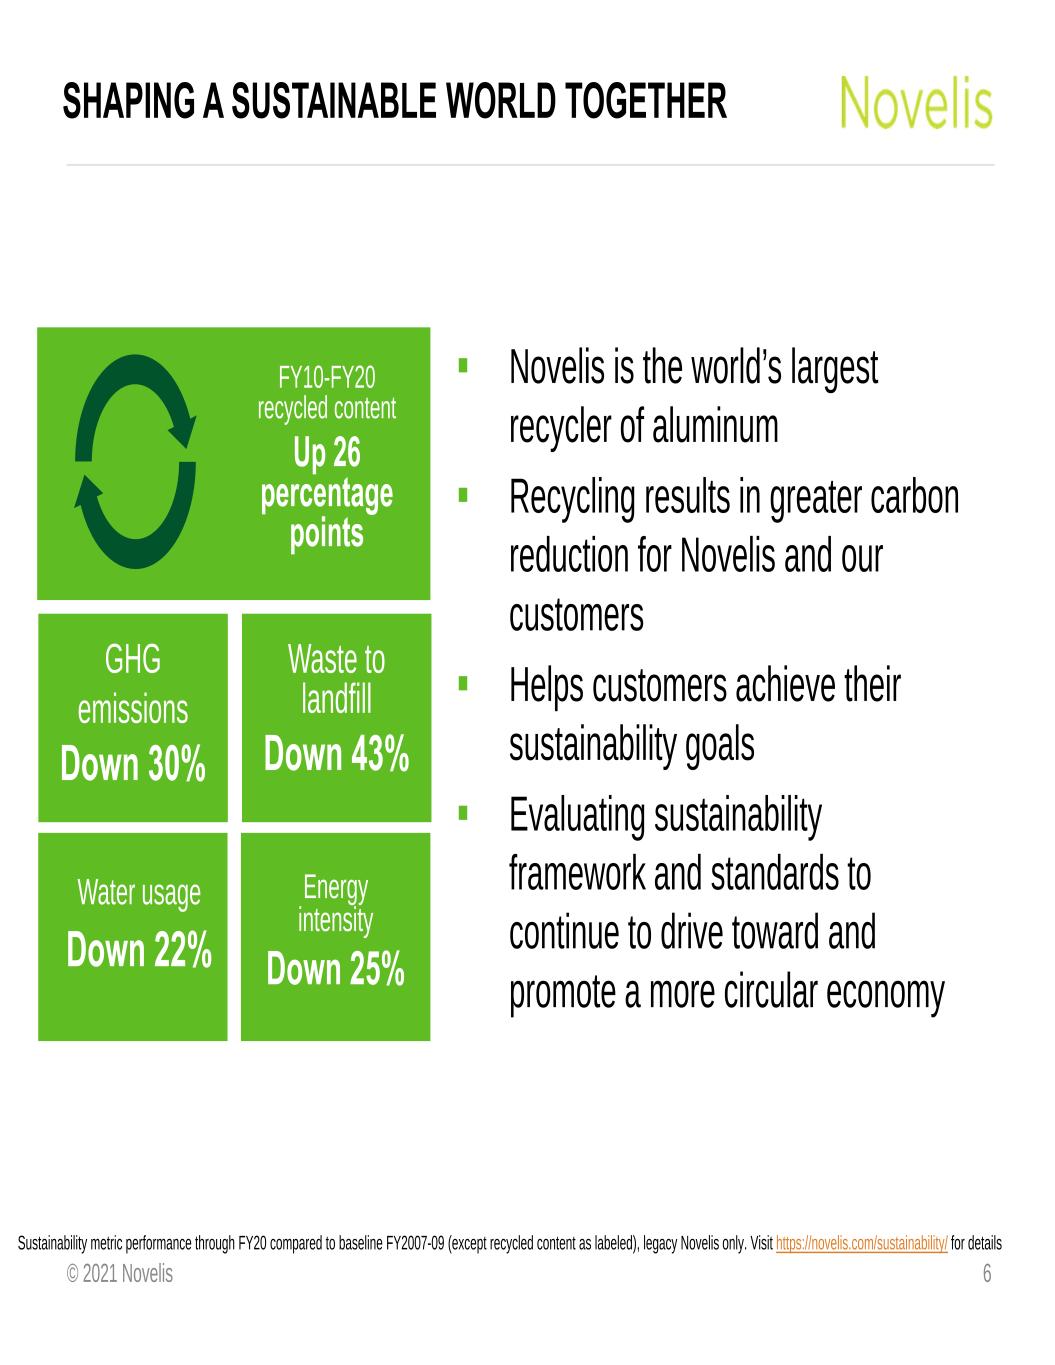
© 2021 Novelis SHAPING A SUSTAINABLE WORLD TOGETHER 6 GHG emissions Down 30% Waste to landfill Down 43% Water usage Down 22% Energy intensity Down 25% FY10-FY20 recycled content Up 26 percentage points Sustainability metric performance through FY20 compared to baseline FY2007-09 (except recycled content as labeled), legacy Novelis only. Visit https://novelis.com/sustainability/ for details Novelis is the world’s largest recycler of aluminum Recycling results in greater carbon reduction for Novelis and our customers Helps customers achieve their sustainability goals Evaluating sustainability framework and standards to continue to drive toward and promote a more circular economy
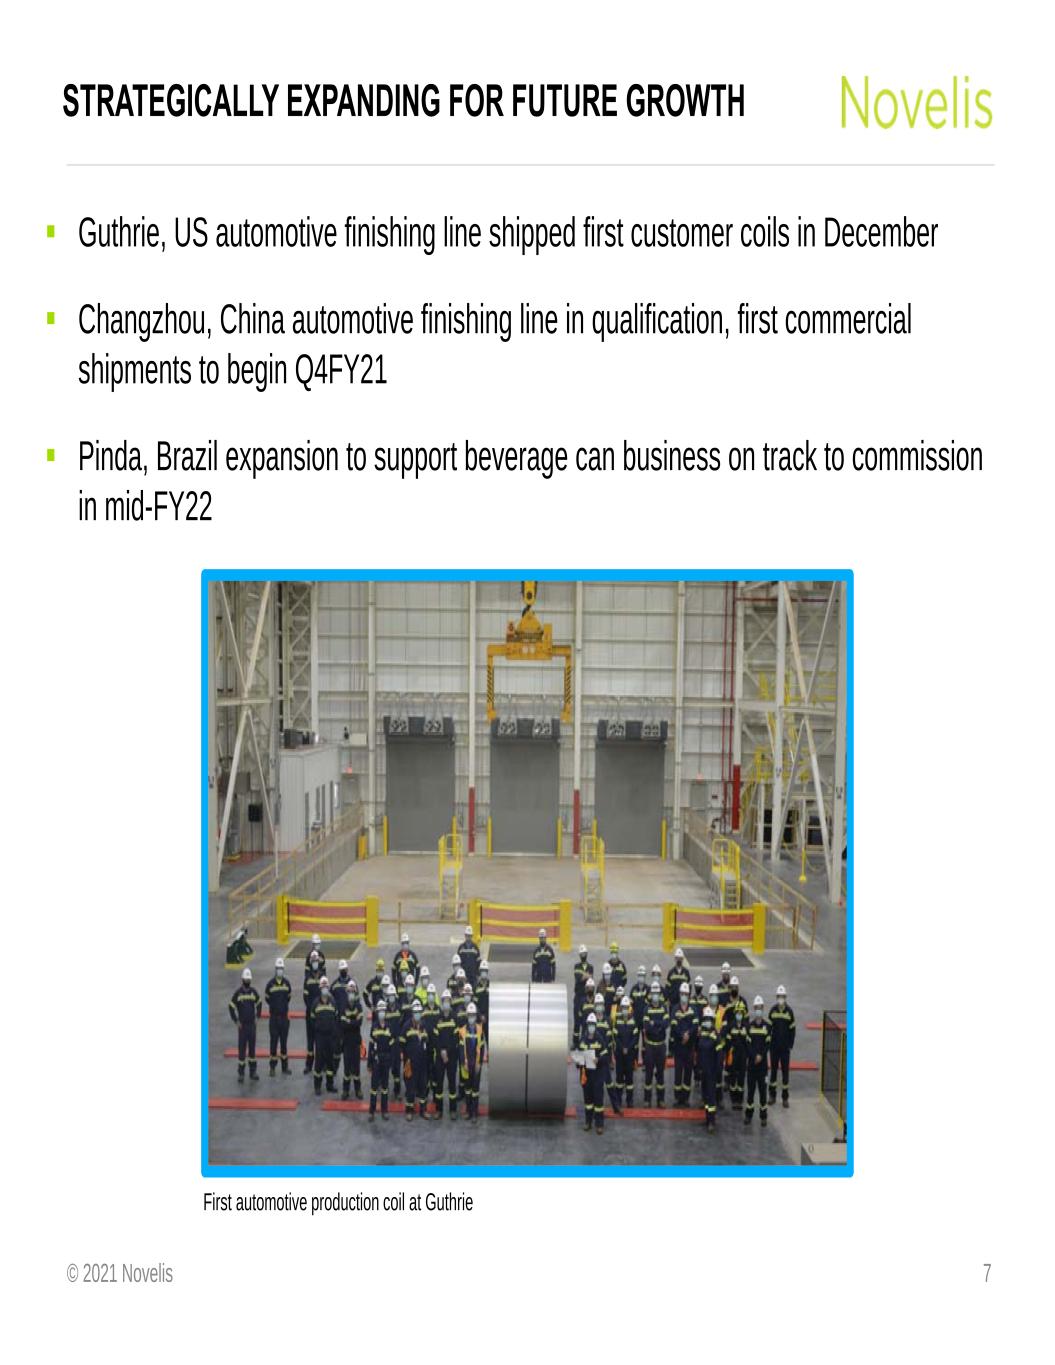
© 2021 Novelis STRATEGICALLY EXPANDING FOR FUTURE GROWTH 7 First automotive production coil at Guthrie Guthrie, US automotive finishing line shipped first customer coils in December Changzhou, China automotive finishing line in qualification, first commercial shipments to begin Q4FY21 Pinda, Brazil expansion to support beverage can business on track to commission in mid-FY22
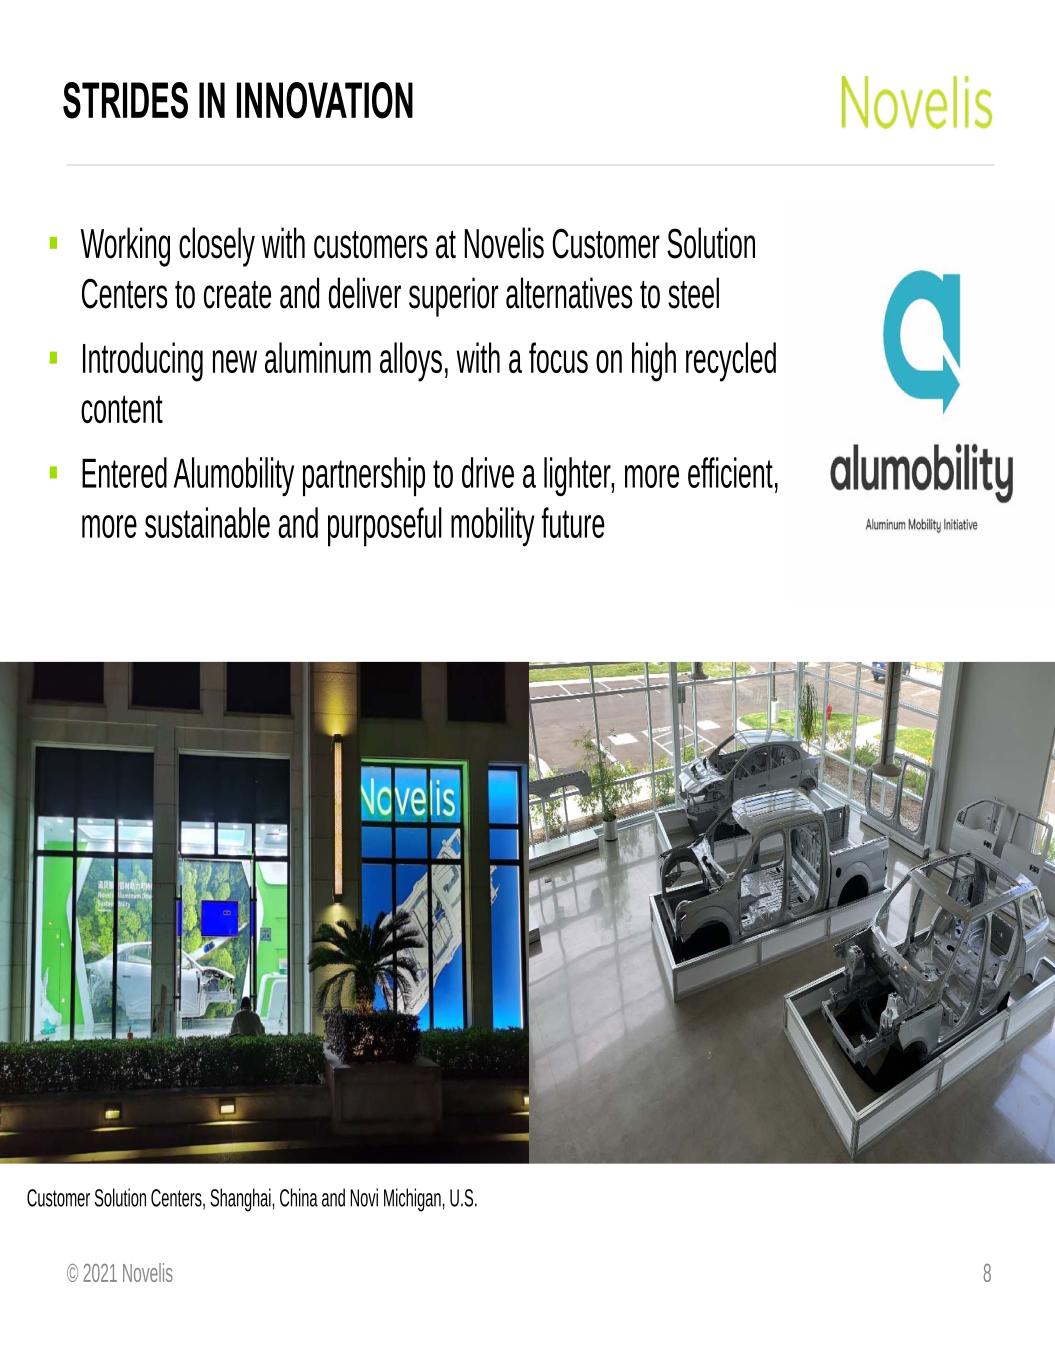
© 2021 Novelis STRIDES IN INNOVATION 8 Customer Solution Centers, Shanghai, China and Novi Michigan, U.S. Working closely with customers at Novelis Customer Solution Centers to create and deliver superior alternatives to steel Introducing new aluminum alloys, with a focus on high recycled content Entered Alumobility partnership to drive a lighter, more efficient, more sustainable and purposeful mobility future

© 2021 Novelis FINANCIAL HIGHLIGHTS
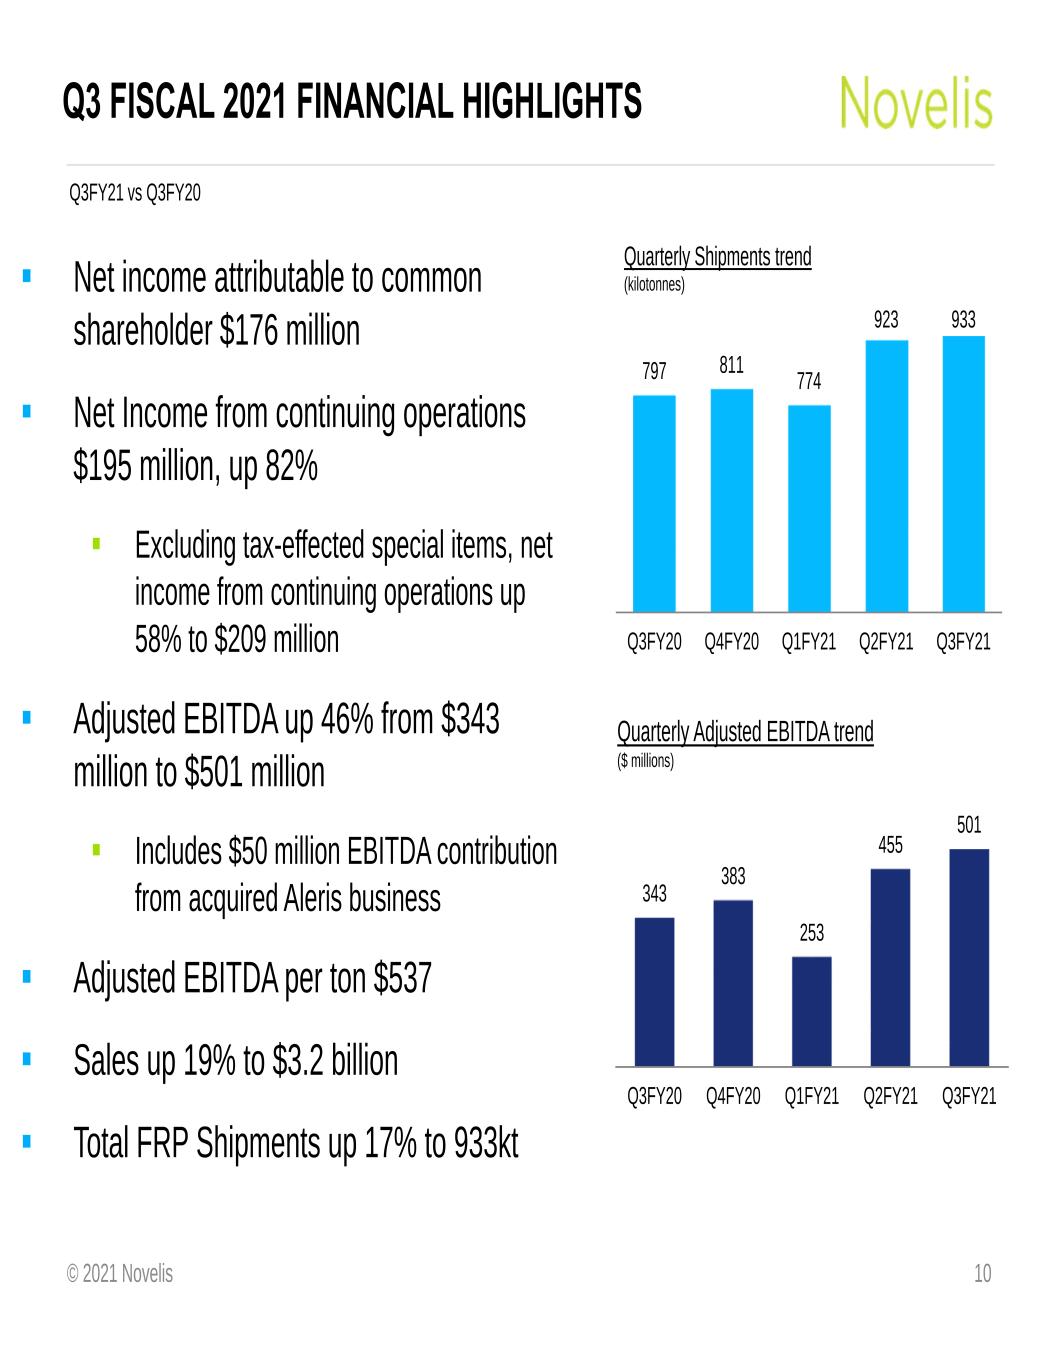
© 2021 Novelis Q3 FISCAL 2021 FINANCIAL HIGHLIGHTS Net income attributable to common shareholder $176 million Net Income from continuing operations $195 million, up 82% Excluding tax-effected special items, net income from continuing operations up 58% to $209 million Adjusted EBITDA up 46% from $343 million to $501 million Includes $50 million EBITDA contribution from acquired Aleris business Adjusted EBITDA per ton $537 Sales up 19% to $3.2 billion Total FRP Shipments up 17% to 933kt 10 Q3FY21 vs Q3FY20 Quarterly Adjusted EBITDA trend ($ millions) 343 383 253 455 501 Q3FY20 Q4FY20 Q1FY21 Q2FY21 Q3FY21 797 811 774 923 933 Q3FY20 Q4FY20 Q1FY21 Q2FY21 Q3FY21 Quarterly Shipments trend (kilotonnes)
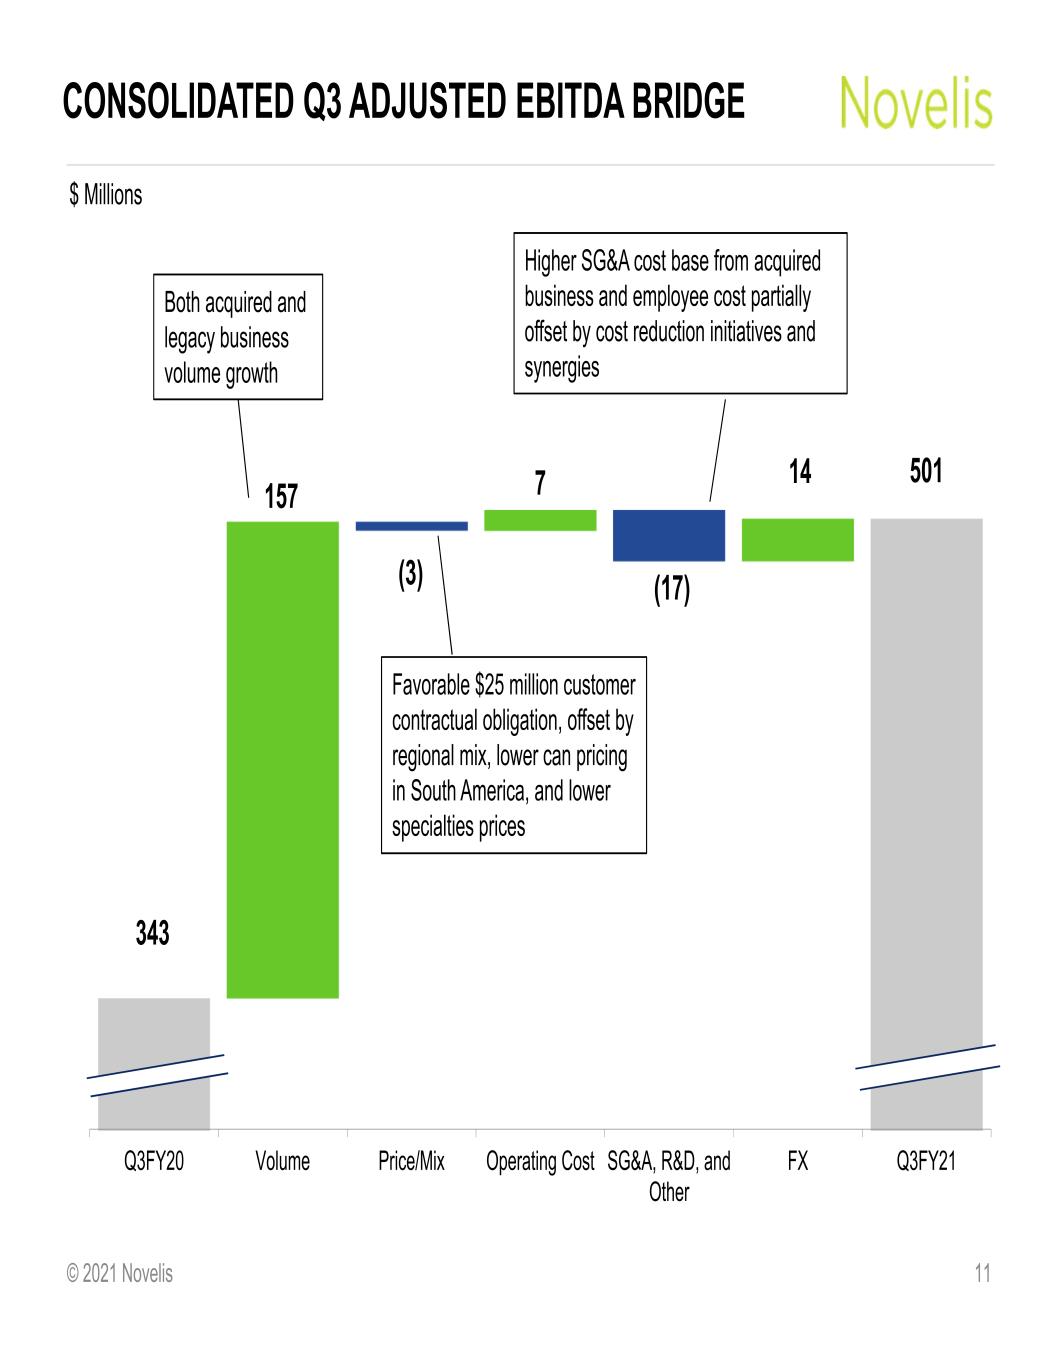
© 2021 Novelis CONSOLIDATED Q3 ADJUSTED EBITDA BRIDGE 11 $ Millions 343 157 (3) 7 (17) 14 501 Q3FY20 Volume Price/Mix Operating Cost SG&A, R&D, and Other FX Q3FY21 Both acquired and legacy business volume growth Higher SG&A cost base from acquired business and employee cost partially offset by cost reduction initiatives and synergies Favorable $25 million customer contractual obligation, offset by regional mix, lower can pricing in South America, and lower specialties prices
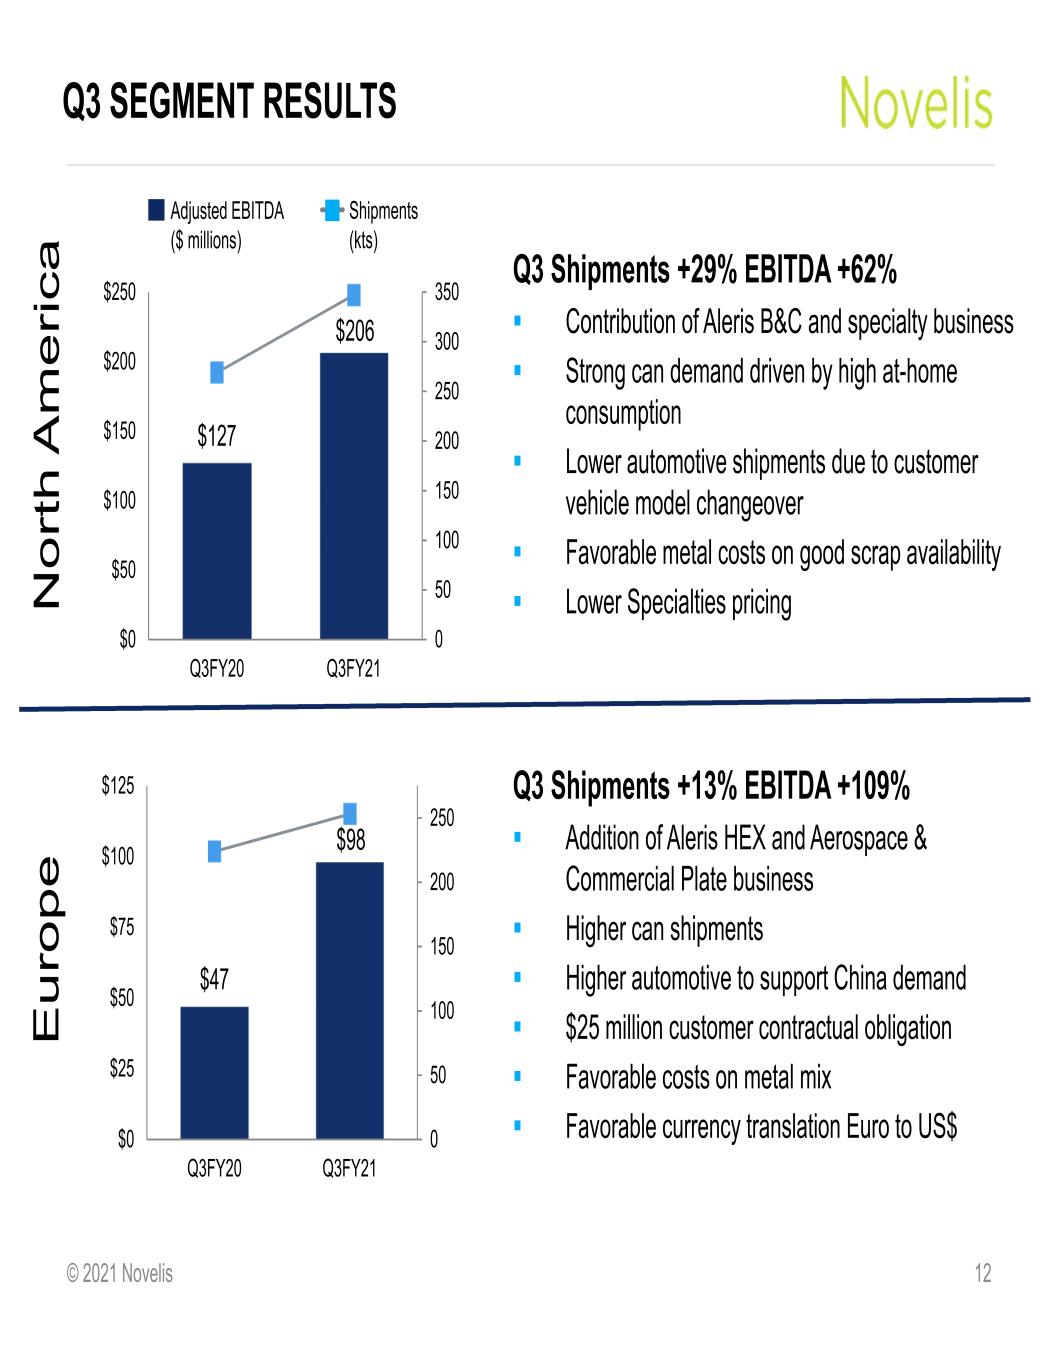
© 2021 Novelis Q3 SEGMENT RESULTS 12 Q3 Shipments +29% EBITDA +62% Contribution of Aleris B&C and specialty business Strong can demand driven by high at-home consumption Lower automotive shipments due to customer vehicle model changeover Favorable metal costs on good scrap availability Lower Specialties pricing $127 $206 0 50 100 150 200 250 300 350 $0 $50 $100 $150 $200 $250 Q3FY20 Q3FY21 Shipments (kts) Adjusted EBITDA ($ millions) N or th A m er ic a E ur op e Q3 Shipments +13% EBITDA +109% Addition of Aleris HEX and Aerospace & Commercial Plate business Higher can shipments Higher automotive to support China demand $25 million customer contractual obligation Favorable costs on metal mix Favorable currency translation Euro to US$ $47 $98 0 50 100 150 200 250 $0 $25 $50 $75 $100 $125 Q3FY20 Q3FY21
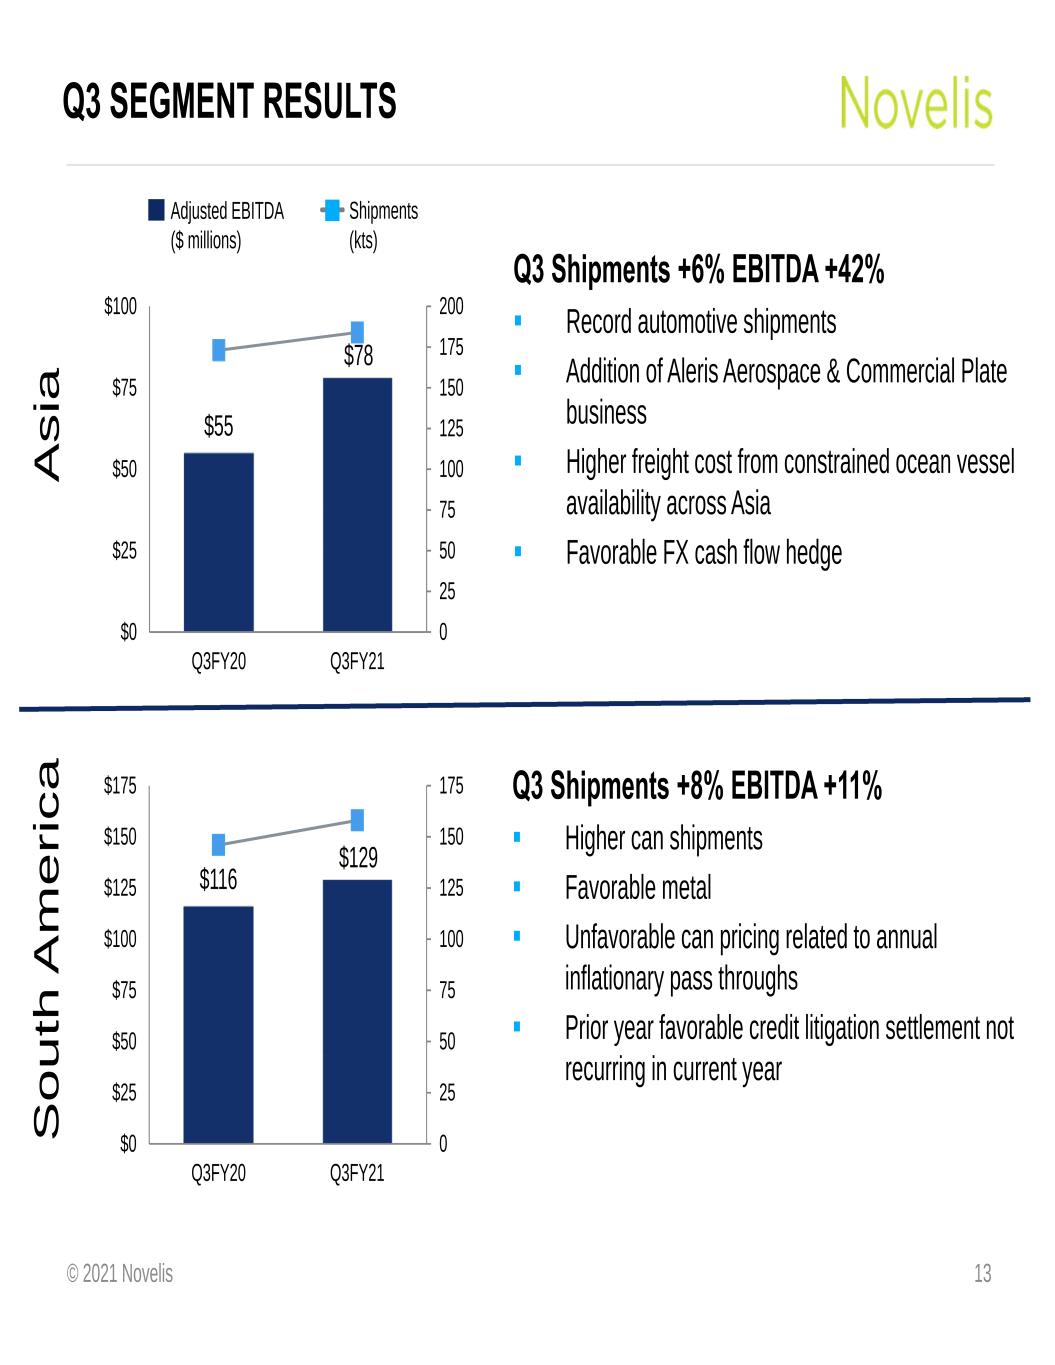
© 2021 Novelis Q3 Shipments +8% EBITDA +11% Higher can shipments Favorable metal Unfavorable can pricing related to annual inflationary pass throughs Prior year favorable credit litigation settlement not recurring in current year Q3 Shipments +6% EBITDA +42% Record automotive shipments Addition of Aleris Aerospace & Commercial Plate business Higher freight cost from constrained ocean vessel availability across Asia Favorable FX cash flow hedge Q3 SEGMENT RESULTS 13 $55 $78 0 25 50 75 100 125 150 175 200 $0 $25 $50 $75 $100 Q3FY20 Q3FY21 A si a S ou th A m er ic a Shipments (kts) Adjusted EBITDA ($ millions) $116 $129 0 25 50 75 100 125 150 175 $0 $25 $50 $75 $100 $125 $150 $175 Q3FY20 Q3FY21
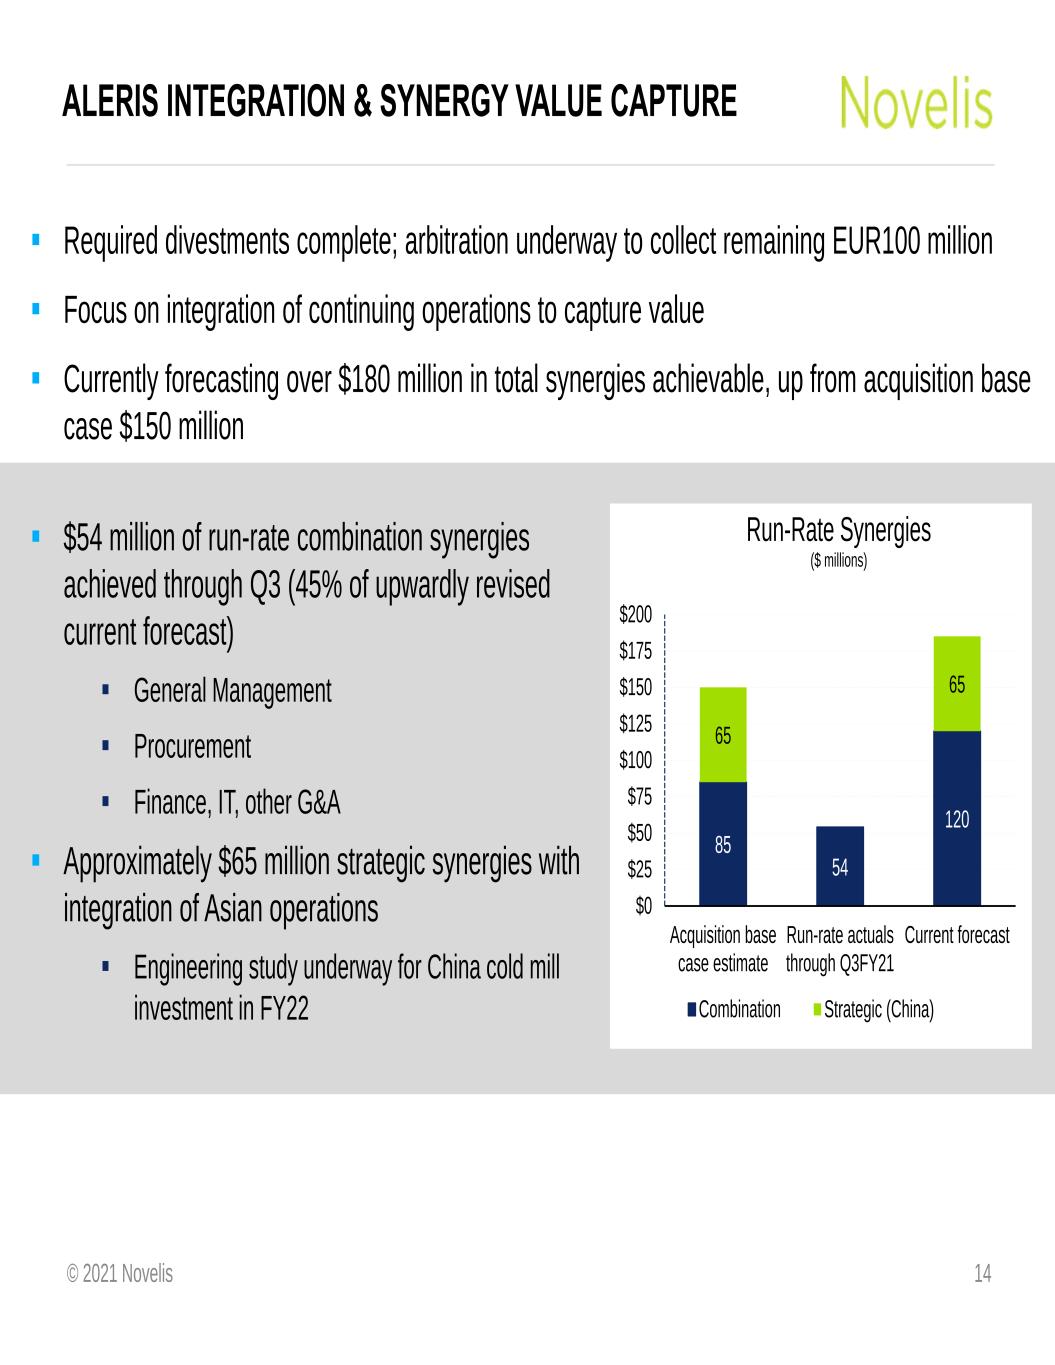
© 2021 Novelis ALERIS INTEGRATION & SYNERGY VALUE CAPTURE Required divestments complete; arbitration underway to collect remaining EUR100 million Focus on integration of continuing operations to capture value Currently forecasting over $180 million in total synergies achievable, up from acquisition base case $150 million 14 85 54 120 65 65 $0 $25 $50 $75 $100 $125 $150 $175 $200 Acquisition base case estimate Run-rate actuals through Q3FY21 Current forecast Run-Rate Synergies ($ millions) Combination Strategic (China) $54 million of run-rate combination synergies achieved through Q3 (45% of upwardly revised current forecast) General Management Procurement Finance, IT, other G&A Approximately $65 million strategic synergies with integration of Asian operations Engineering study underway for China cold mill investment in FY22
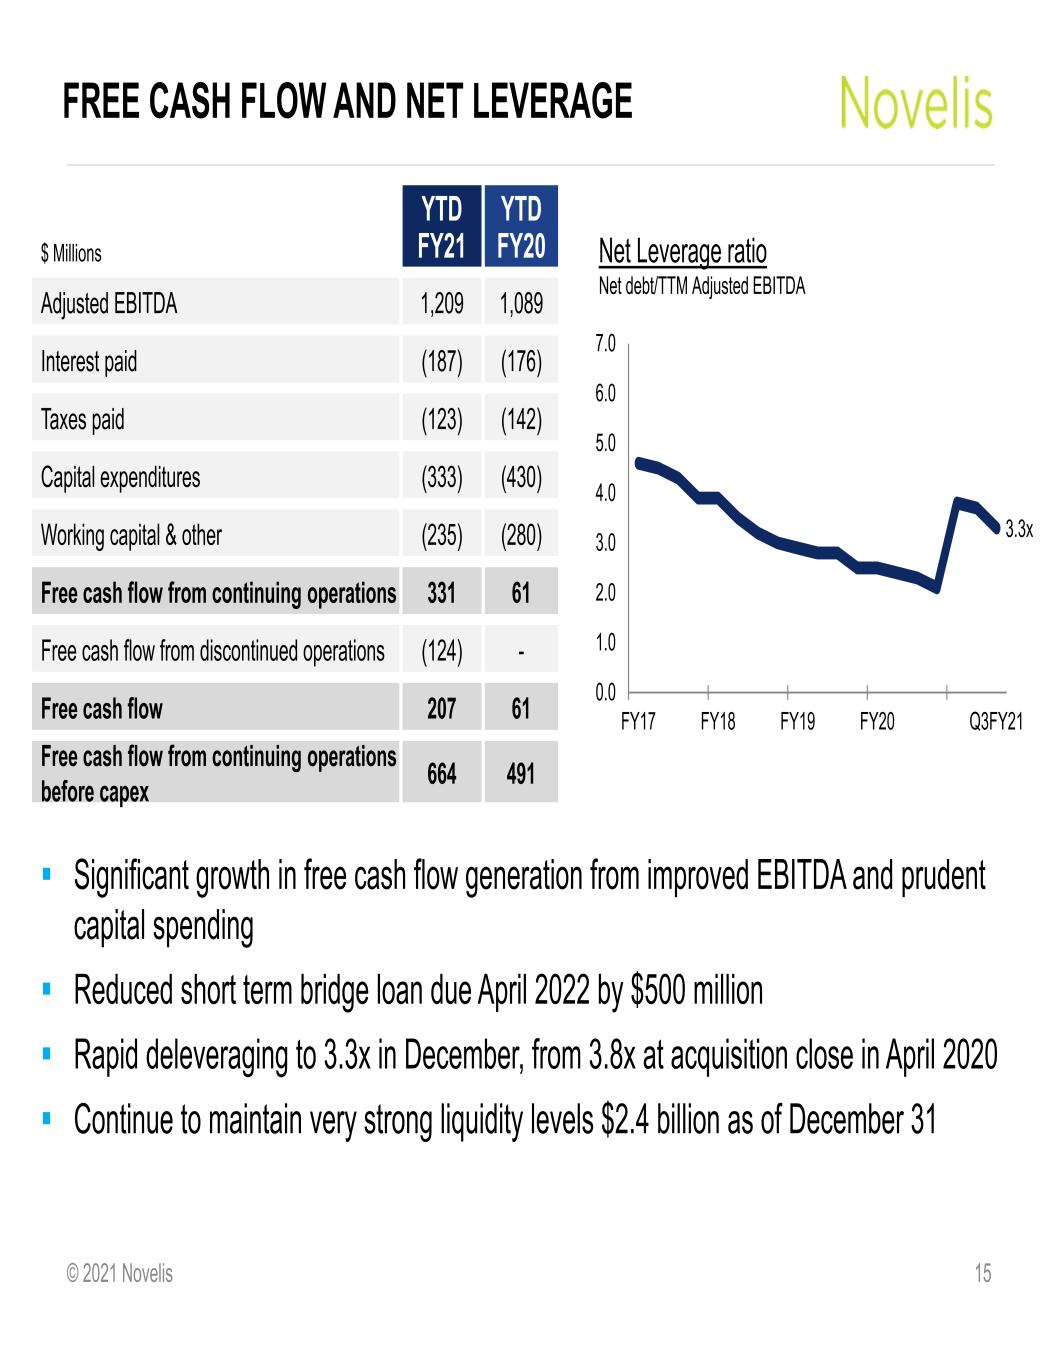
© 2021 Novelis FREE CASH FLOW AND NET LEVERAGE 15 YTD FY21 YTD FY20 Adjusted EBITDA 1,209 1,089 Interest paid (187) (176) Taxes paid (123) (142) Capital expenditures (333) (430) Working capital & other (235) (280) Free cash flow from continuing operations 331 61 Free cash flow from discontinued operations (124) - Free cash flow 207 61 Free cash flow from continuing operations before capex 664 491 $ Millions Significant growth in free cash flow generation from improved EBITDA and prudent capital spending Reduced short term bridge loan due April 2022 by $500 million Rapid deleveraging to 3.3x in December, from 3.8x at acquisition close in April 2020 Continue to maintain very strong liquidity levels $2.4 billion as of December 31 Net Leverage ratio Net debt/TTM Adjusted EBITDA 3.3x 0.0 1.0 2.0 3.0 4.0 5.0 6.0 7.0 FY17 FY18 FY19 FY20 Q3FY21
© 2021 Novelis SUMMARY 16 Strong customer relationships across diversified product portfolio, operational excellence, and expanded global presence deliver record quarterly results Favorable demand trends for aluminum FRP across most end markets Diverse global footprint and product portfolio provides competitive advantage and flexibility Integration of Aleris continuing operations to drive synergies and value capture Investing in organic expansion projects and innovation to strengthen and grow our business in the near- and long-term

© 2021 Novelis THANK YOU QUESTIONS?
© 2021 Novelis APPENDIX
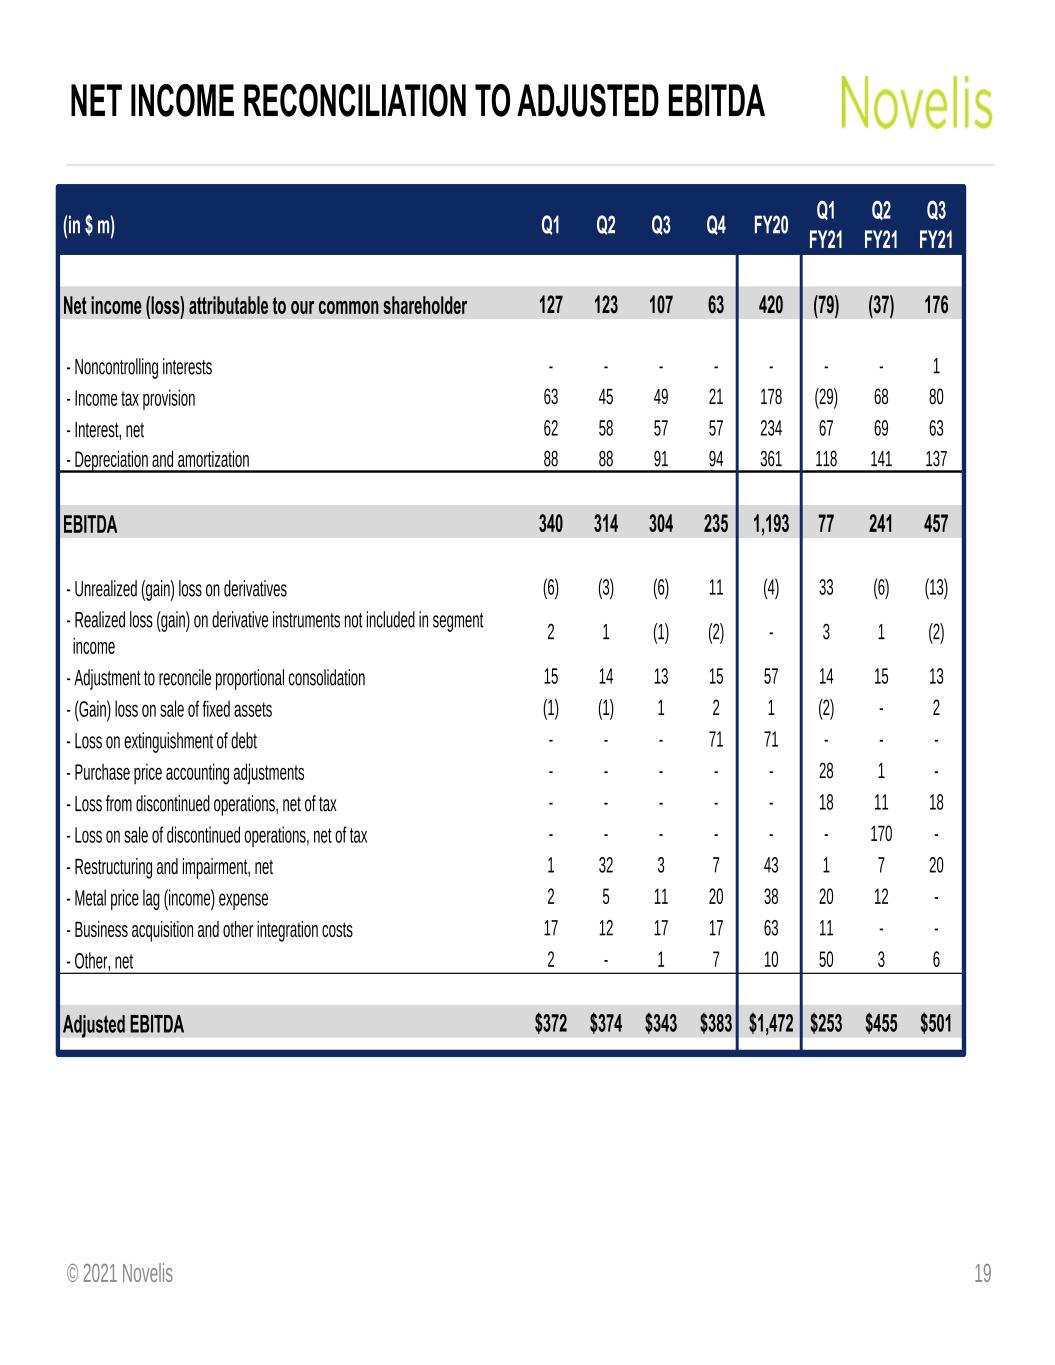
© 2021 Novelis (in $ m) Q1 Q2 Q3 Q4 FY20 Q1 FY21 Q2 FY21 Q3 FY21 Net income (loss) attributable to our common shareholder 127 123 107 63 420 (79) (37) 176 - Noncontrolling interests - - - - - - - 1 - Income tax provision 63 45 49 21 178 (29) 68 80 - Interest, net 62 58 57 57 234 67 69 63 - Depreciation and amortization 88 88 91 94 361 118 141 137 EBITDA 340 314 304 235 1,193 77 241 457 - Unrealized (gain) loss on derivatives (6) (3) (6) 11 (4) 33 (6) (13) - Realized loss (gain) on derivative instruments not included in segment income 2 1 (1) (2) - 3 1 (2) - Adjustment to reconcile proportional consolidation 15 14 13 15 57 14 15 13 - (Gain) loss on sale of fixed assets (1) (1) 1 2 1 (2) - 2 - Loss on extinguishment of debt - - - 71 71 - - - - Purchase price accounting adjustments - - - - - 28 1 - - Loss from discontinued operations, net of tax - - - - - 18 11 18 - Loss on sale of discontinued operations, net of tax - - - - - - 170 - - Restructuring and impairment, net 1 32 3 7 43 1 7 20 - Metal price lag (income) expense 2 5 11 20 38 20 12 - - Business acquisition and other integration costs 17 12 17 17 63 11 - - - Other, net 2 - 1 7 10 50 3 6 Adjusted EBITDA $372 $374 $343 $383 $1,472 $253 $455 $501 NET INCOME RECONCILIATION TO ADJUSTED EBITDA 19
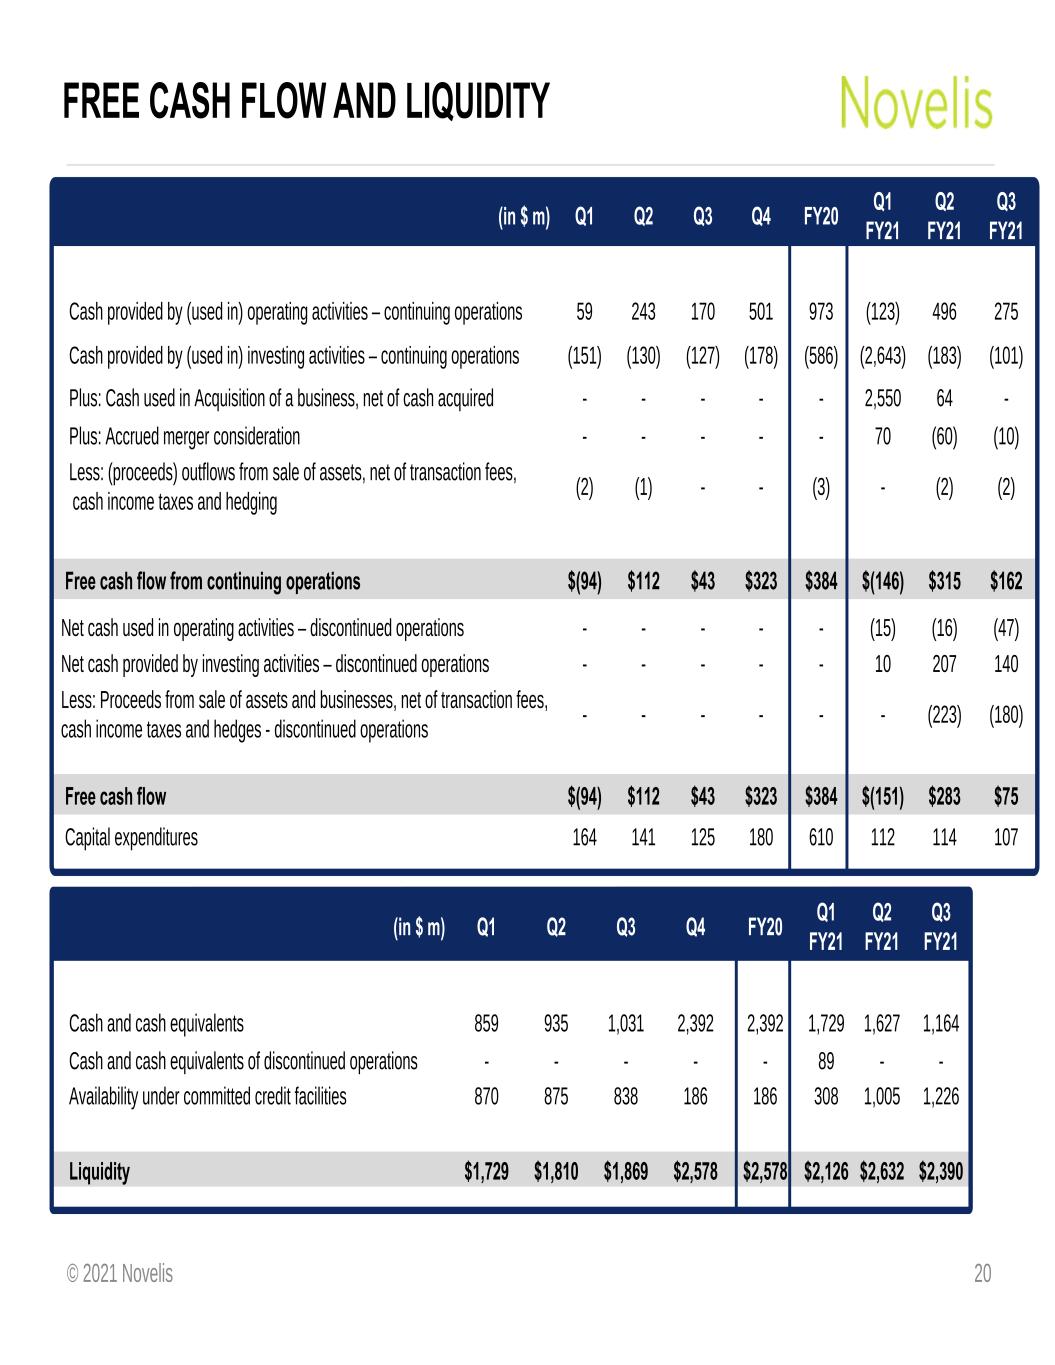
© 2021 Novelis FREE CASH FLOW AND LIQUIDITY 20 (in $ m) Q1 Q2 Q3 Q4 FY20 Q1 FY21 Q2 FY21 Q3 FY21 Cash provided by (used in) operating activities – continuing operations 59 243 170 501 973 (123) 496 275 Cash provided by (used in) investing activities – continuing operations (151) (130) (127) (178) (586) (2,643) (183) (101) Plus: Cash used in Acquisition of a business, net of cash acquired - - - - - 2,550 64 - Plus: Accrued merger consideration - - - - - 70 (60) (10) Less: (proceeds) outflows from sale of assets, net of transaction fees, cash income taxes and hedging (2) (1) - - (3) - (2) (2) Free cash flow from continuing operations $(94) $112 $43 $323 $384 $(146) $315 $162 Net cash used in operating activities – discontinued operations - - - - - (15) (16) (47) Net cash provided by investing activities – discontinued operations - - - - - 10 207 140 Less: Proceeds from sale of assets and businesses, net of transaction fees, cash income taxes and hedges - discontinued operations - - - - - - (223) (180) Free cash flow $(94) $112 $43 $323 $384 $(151) $283 $75 Capital expenditures 164 141 125 180 610 112 114 107 (in $ m) Q1 Q2 Q3 Q4 FY20 Q1 FY21 Q2 FY21 Q3 FY21 Cash and cash equivalents 859 935 1,031 2,392 2,392 1,729 1,627 1,164 Cash and cash equivalents of discontinued operations - - - - - 89 - - Availability under committed credit facilities 870 875 838 186 186 308 1,005 1,226 Liquidity $1,729 $1,810 $1,869 $2,578 $2,578 $2,126 $2,632 $2,390