EXHIBIT 99.2 PRESENTATION SLIDES
Published on August 11, 2015
©2015Novelis Inc. 1 August 11, 2015 Steve Fisher President and Chief Executive Officer Novelis Q1 Fiscal Year 2016 Earnings Conference Call Exhibit 99.2
©2015Novelis Inc. 2 Safe Harbor Statement Forward-looking statements Statements made in this presentation which describe Novelis' intentions, expectations, beliefs or predictions may be forward-looking statements within the meaning of securities laws. Forward-looking statements include statements preceded by, followed by, or including the words "believes," "expects," "anticipates," "plans," "estimates," "projects," "forecasts," or similar expressions. Examples of forward-looking statements in this presentation are statements about the company’s expectations for working capital improvement, higher EBITDA and lower capital spending over the remaining quarters of fiscal 2016 to result in positive free cash flow for the full fiscal year. Novelis cautions that, by their nature, forward-looking statements involve risk and uncertainty and that Novelis' actual results could differ materially from those expressed or implied in such statements. We do not intend, and we disclaim, any obligation to update any forward-looking statements, whether as a result of new information, future events or otherwise. Factors that could cause actual results or outcomes to differ from the results expressed or implied by forward-looking statements include, among other things: changes in the prices and availability of aluminum (or premiums associated with such prices) or other materials and raw materials we use; the capacity and effectiveness of our hedging activities; relationships with, and financial and operating conditions of, our customers, suppliers and other stakeholders; fluctuations in the supply of, and prices for, energy in the areas in which we maintain production facilities; our ability to access financing for future capital requirements; changes in the relative values of various currencies and the effectiveness of our currency hedging activities; factors affecting our operations, such as litigation, environmental remediation and clean-up costs, labor relations and negotiations, breakdown of equipment and other events; the impact of restructuring efforts in the future; economic, regulatory and political factors within the countries in which we operate or sell our products, including changes in duties or tariffs; competition from other aluminum rolled products producers as well as from substitute materials such as steel, glass, plastic and composite materials; changes in general economic conditions including deterioration in the global economy, particularly sectors in which our customers operate; cyclical demand and pricing within the principal markets for our products as well as seasonality in certain of our customers’ industries; changes in government regulations, particularly those affecting taxes, environmental, health or safety compliance; changes in interest rates that have the effect of increasing the amounts we pay under our credit facilities and other financing agreements; the effect of taxes and changes in tax rates; and our level of indebtedness and our ability to generate cash. The above list of factors is not exhaustive. Other important risk factors included under the caption "Risk Factors" in our Annual Report on Form 10-K for the fiscal year ended March 31, 2015 are specifically incorporated by reference into this presentation.
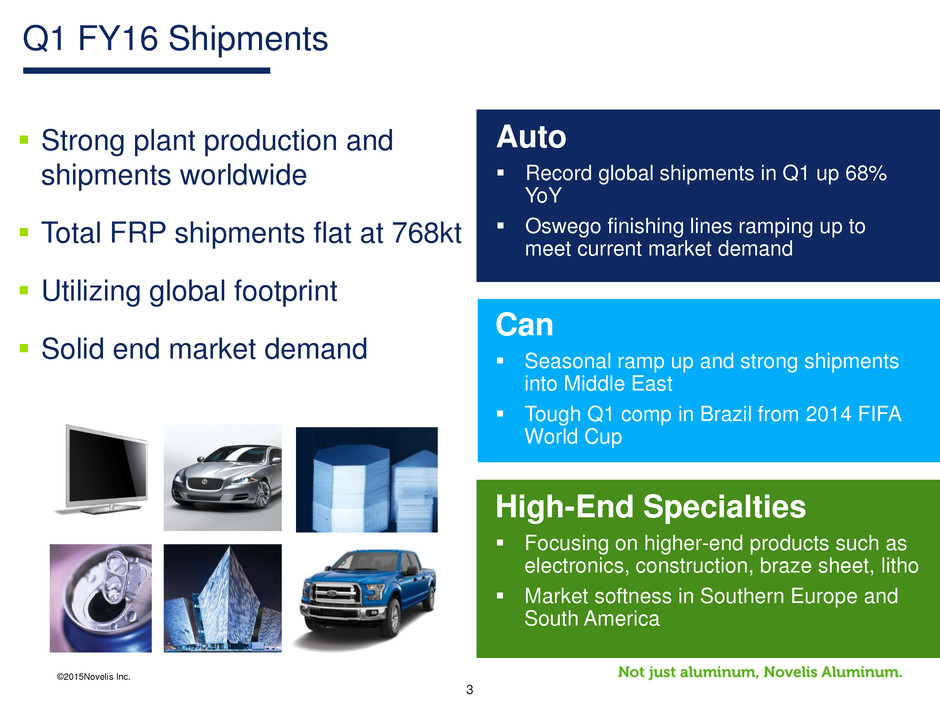
©2015Novelis Inc. 3 Q1 FY16 Shipments Can Seasonal ramp up and strong shipments into Middle East Tough Q1 comp in Brazil from 2014 FIFA World Cup High-End Specialties Focusing on higher-end products such as electronics, construction, braze sheet, litho Market softness in Southern Europe and South America Auto Record global shipments in Q1 up 68% YoY Oswego finishing lines ramping up to meet current market demand Strong plant production and shipments worldwide Total FRP shipments flat at 768kt Utilizing global footprint Solid end market demand
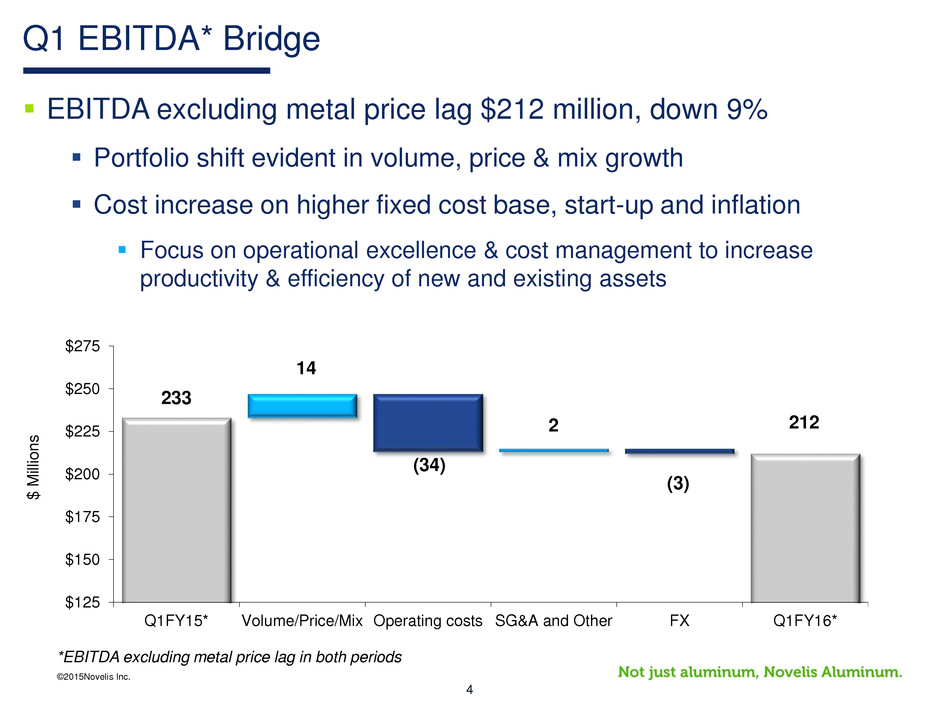
©2015Novelis Inc. 4 Q1 EBITDA* Bridge $ M ill io n s 233 14 (34) 2 (3) 212 $125 $150 $175 $200 $225 $250 $275 Q1FY15* Volume/Price/Mix Operating costs SG&A and Other FX Q1FY16* *EBITDA excluding metal price lag in both periods EBITDA excluding metal price lag $212 million, down 9% Portfolio shift evident in volume, price & mix growth Cost increase on higher fixed cost base, start-up and inflation Focus on operational excellence & cost management to increase productivity & efficiency of new and existing assets
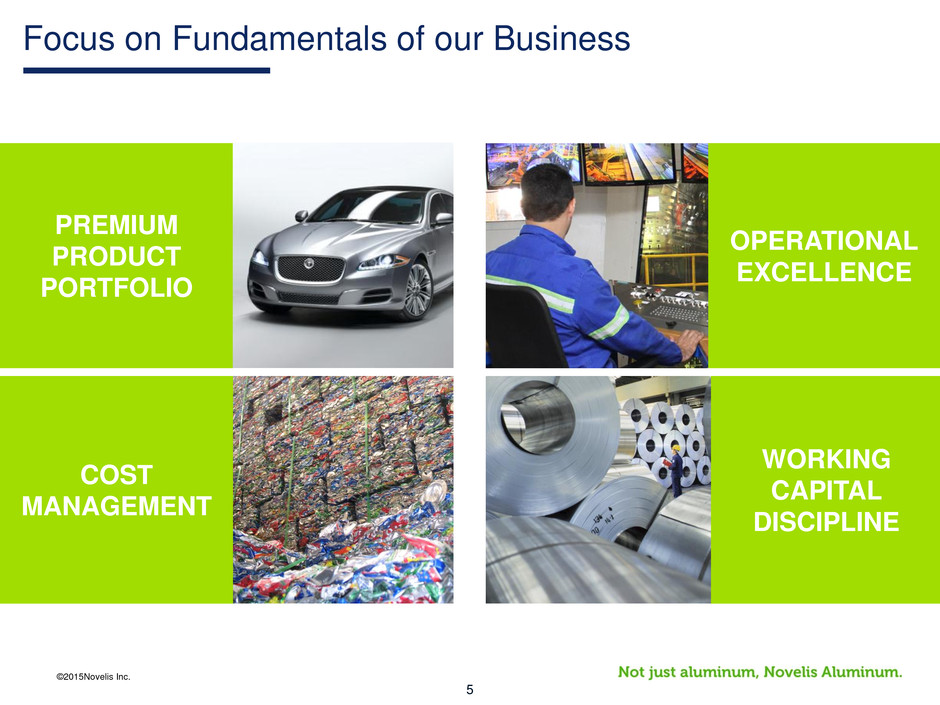
©2015Novelis Inc. 5 OPERATIONAL EXCELLENCE Focus on Fundamentals of our Business WORKING CAPITAL DISCIPLINE PREMIUM PRODUCT PORTFOLIO COST MANAGEMENT
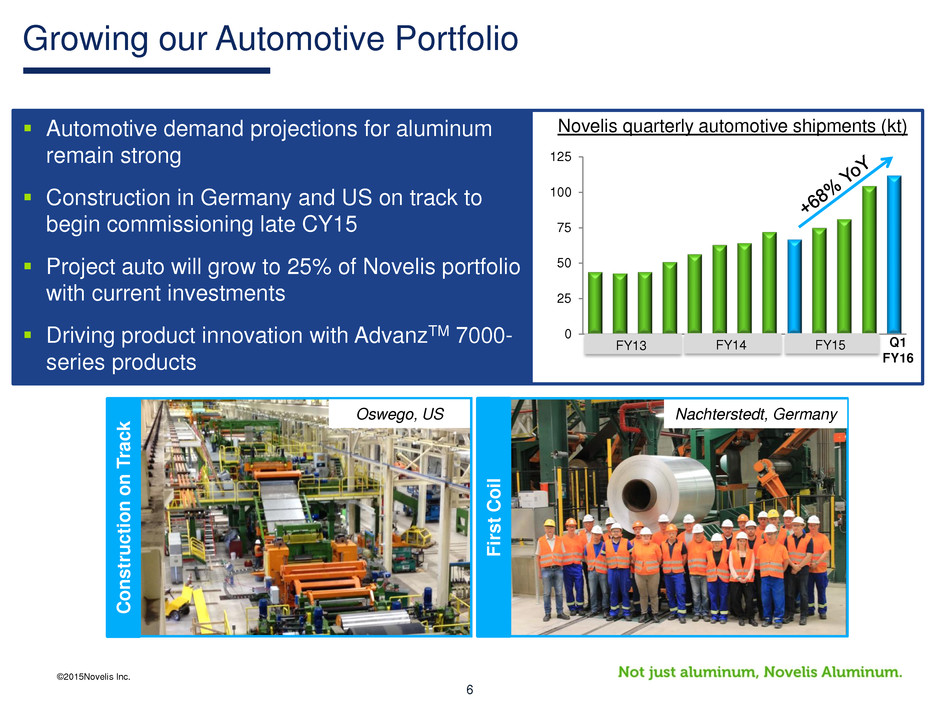
©2015Novelis Inc. 6 Growing our Automotive Portfolio Automotive demand projections for aluminum remain strong Construction in Germany and US on track to begin commissioning late CY15 Project auto will grow to 25% of Novelis portfolio with current investments Driving product innovation with AdvanzTM 7000- series products 0 25 50 75 100 125 FY13 Q1 FY16 Novelis quarterly automotive shipments (kt) FY14 FY15 Oswego, US F ir st C o il Nachterstedt, Germany C o n st ru ct io n o n T rac k

©2015Novelis Inc. 7 Financial Highlights
©2015Novelis Inc. 8 First Quarter Fiscal 2016 Financial Highlights Total FRP shipments of 768kt, down 2kt Sales down 2% to $2.6 billion Driven by 2% lower average LME aluminum price and 39% lower average regional metal premiums compared to prior year Excluding metal price lag, EBITDA $212 million down 9% EBITDA, including negative $85 million of metal price lag, was $127 million Net loss $60 million; Excluding certain items, net income down to $24 million compared to $28 million in prior year Negative free cash flow $425 million Liquidity $1.2 billion Q1FY16 vs Q1FY15
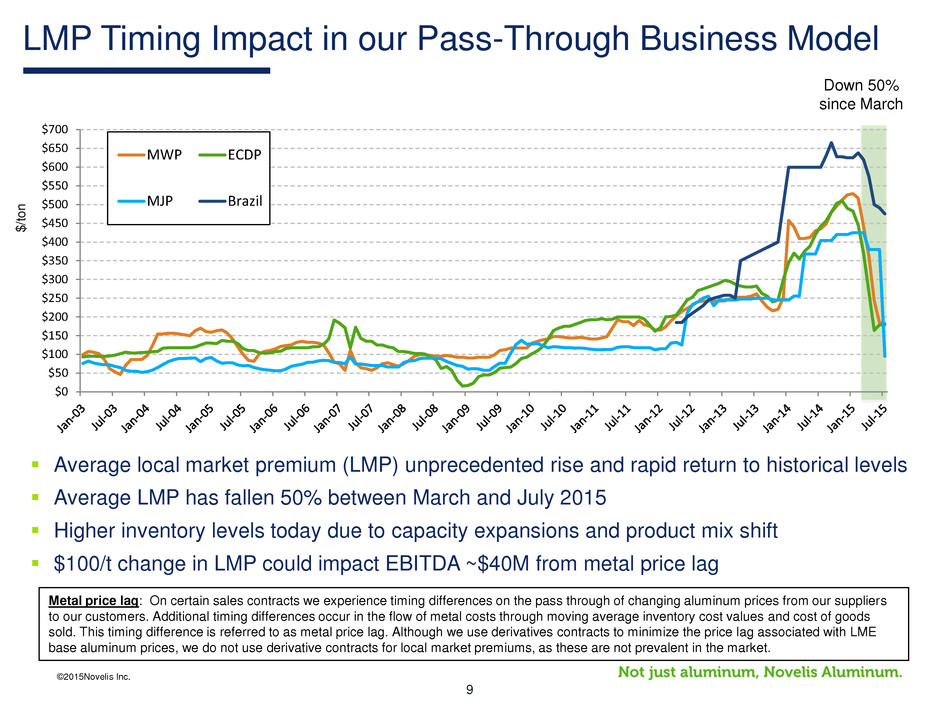
©2015Novelis Inc. 9 LMP Timing Impact in our Pass-Through Business Model Metal price lag: On certain sales contracts we experience timing differences on the pass through of changing aluminum prices from our suppliers to our customers. Additional timing differences occur in the flow of metal costs through moving average inventory cost values and cost of goods sold. This timing difference is referred to as metal price lag. Although we use derivatives contracts to minimize the price lag associated with LME base aluminum prices, we do not use derivative contracts for local market premiums, as these are not prevalent in the market. $ /t o n Average local market premium (LMP) unprecedented rise and rapid return to historical levels Average LMP has fallen 50% between March and July 2015 Higher inventory levels today due to capacity expansions and product mix shift $100/t change in LMP could impact EBITDA ~$40M from metal price lag $0 $50 $100 $150 $200 $250 $300 $350 $400 $450 $500 $550 $600 $650 $700 MWP ECDP MJP Brazil Down 50% since March
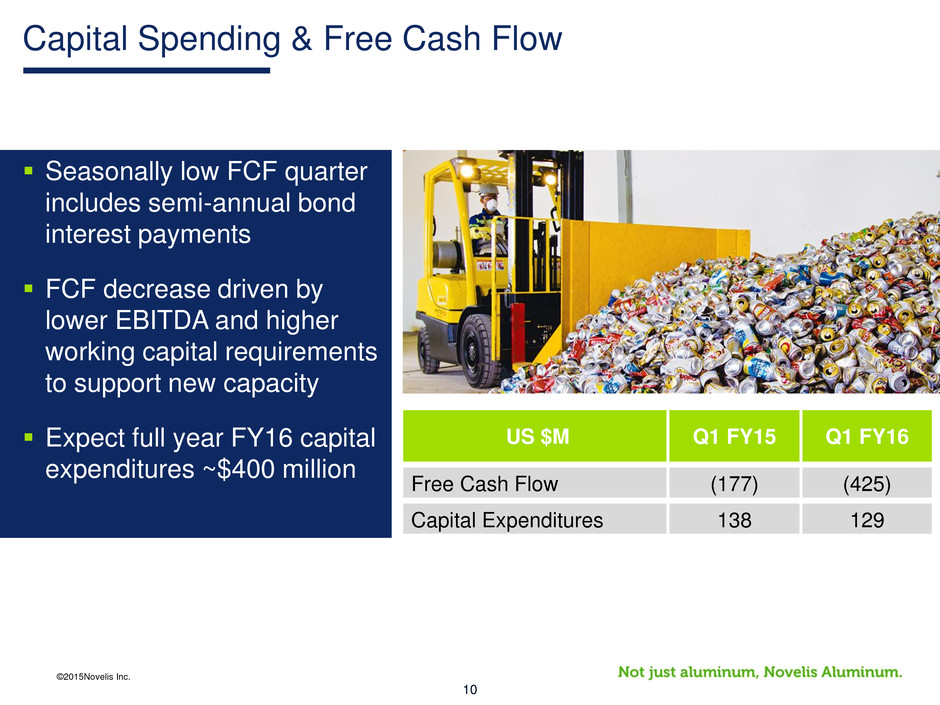
©2015Novelis Inc. 10 Capital Spending & Free Cash Flow US $M Q1 FY15 Q1 FY16 Free Cash Flow (177) (425) Capital Expenditures 138 129 Seasonally low FCF quarter includes semi-annual bond interest payments FCF decrease driven by lower EBITDA and higher working capital requirements to support new capacity Expect full year FY16 capital expenditures ~$400 million
©2015Novelis Inc. 11 Uncertain market factors to continue FRP demand solid but economic uncertainty causing select market softness Stronger US dollar causing headwinds in Europe Negative metal price lag expected in Q2FY16 Focus on fundamentals of manufacturing operations Operational excellence and increasing productivity of new assets Further auto shipment growth as production annualizes Manage costs and working capital Expect positive free cash flow for FY16 Summary & Outlook Despite market challenges, business fundamentals remain strong

©2015Novelis Inc. 12 Questions & Answers

©2015Novelis Inc. 13 Appendix
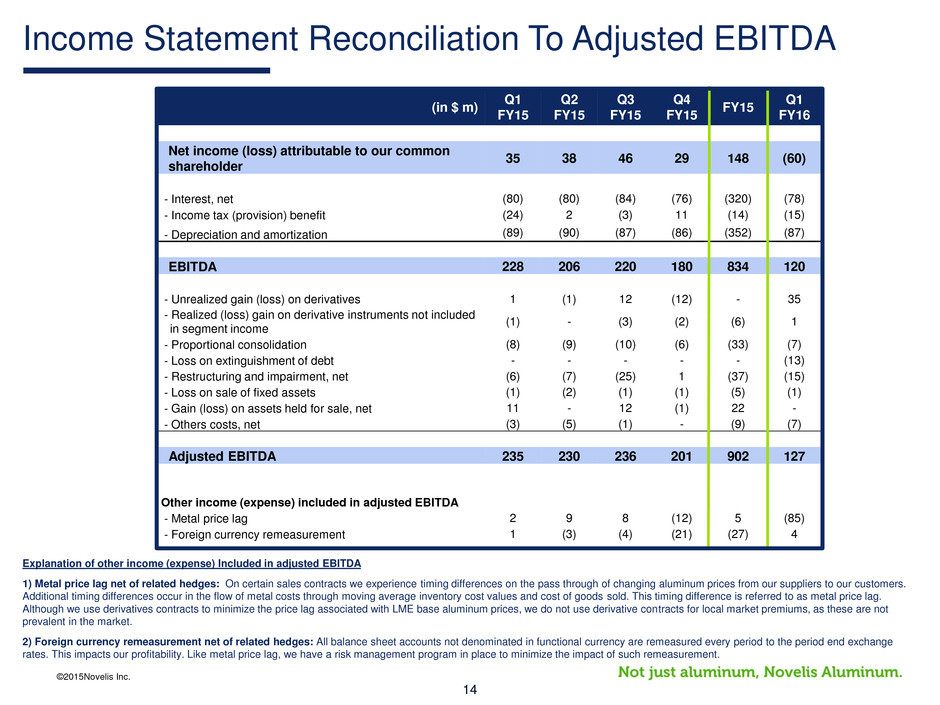
©2015Novelis Inc. 14 (in $ m) Q1 FY15 Q2 FY15 Q3 FY15 Q4 FY15 FY15 Q1 FY16 Net income (loss) attributable to our common shareholder 35 38 46 29 148 (60) - Interest, net (80) (80) (84) (76) (320) (78) - Income tax (provision) benefit (24) 2 (3) 11 (14) (15) - Depreciation and amortization (89) (90) (87) (86) (352) (87) EBITDA 228 206 220 180 834 120 - Unrealized gain (loss) on derivatives 1 (1) 12 (12) - 35 - Realized (loss) gain on derivative instruments not included in segment income (1) - (3) (2) (6) 1 - Proportional consolidation (8) (9) (10) (6) (33) (7) - Loss on extinguishment of debt - - - - - (13) - Restructuring and impairment, net (6) (7) (25) 1 (37) (15) - Loss on sale of fixed assets (1) (2) (1) (1) (5) (1) - Gain (loss) on assets held for sale, net 11 - 12 (1) 22 - - Others costs, net (3) (5) (1) - (9) (7) Adjusted EBITDA 235 230 236 201 902 127 Other income (expense) included in adjusted EBITDA - Metal price lag 2 9 8 (12) 5 (85) - Foreign currency remeasurement 1 (3) (4) (21) (27) 4 Income Statement Reconciliation To Adjusted EBITDA Explanation of other income (expense) Included in adjusted EBITDA 1) Metal price lag net of related hedges: On certain sales contracts we experience timing differences on the pass through of changing aluminum prices from our suppliers to our customers. Additional timing differences occur in the flow of metal costs through moving average inventory cost values and cost of goods sold. This timing difference is referred to as metal price lag. Although we use derivatives contracts to minimize the price lag associated with LME base aluminum prices, we do not use derivative contracts for local market premiums, as these are not prevalent in the market. 2) Foreign currency remeasurement net of related hedges: All balance sheet accounts not denominated in functional currency are remeasured every period to the period end exchange rates. This impacts our profitability. Like metal price lag, we have a risk management program in place to minimize the impact of such remeasurement.
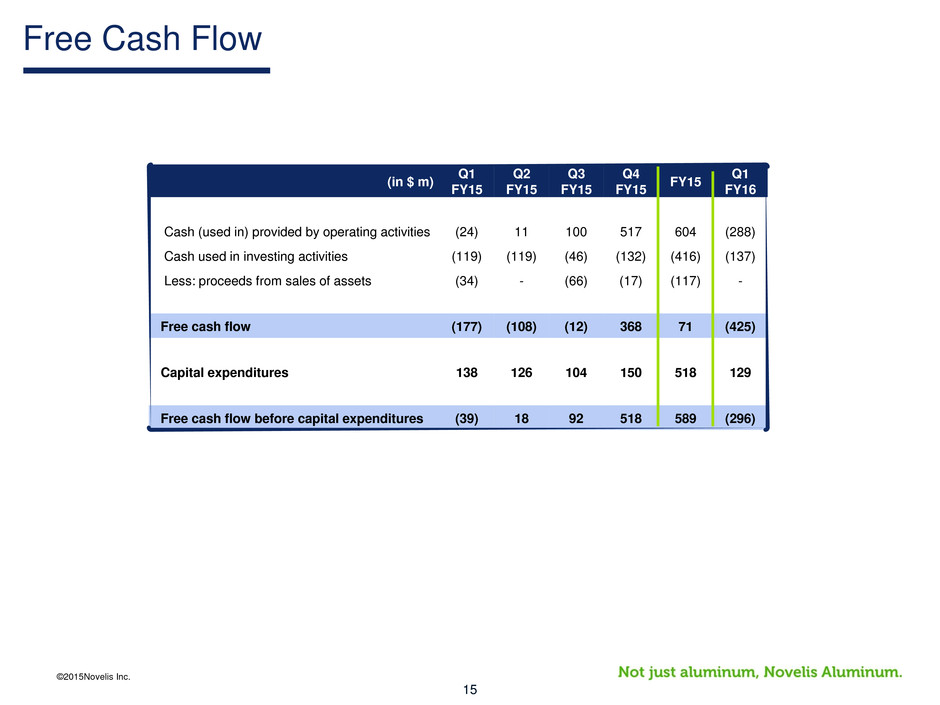
©2015Novelis Inc. 15 (in $ m) Q1 FY15 Q2 FY15 Q3 FY15 Q4 FY15 FY15 Q1 FY16 Cash (used in) provided by operating activities (24) 11 100 517 604 (288) Cash used in investing activities (119) (119) (46) (132) (416) (137) Less: proceeds from sales of assets (34) - (66) (17) (117) - Free cash flow (177) (108) (12) 368 71 (425) Capital expenditures 138 126 104 150 518 129 Free cash flow before capital expenditures (39) 18 92 518 589 (296) Free Cash Flow