EARNINGSSLIDES
Published on November 12, 2013
©2013Novelis Inc. 1 November 11, 2013 Philip Martens President and Chief Executive Officer Steve Fisher Senior Vice President and Chief Financial Officer Novelis Q2 Fiscal Year 2014 Earnings Conference Call Exhibit 99.2
©2013Novelis Inc. 2 Safe Harbor Statement Forward-Looking Statements Statements made in this presentation which describe Novelis' intentions, expectations, beliefs or predictions may be forward-looking statements within the meaning of securities laws. Forward-looking statements include statements preceded by, followed by, or including the words "believes," "expects," "anticipates," "plans," "estimates," "projects," "forecasts," or similar expressions. Examples of forward-looking statements in this presentation are statements about expected FRP market growth globally and in our key product segments of beverage can, automotive and specialties. Novelis cautions that, by their nature, forward-looking statements involve risk and uncertainty and that Novelis' actual results could differ materially from those expressed or implied in such statements. We do not intend, and we disclaim any obligation, to update any forward-looking statements, whether as a result of new information, future events or otherwise. Factors that could cause actual results or outcomes to differ from the results expressed or implied by forward-looking statements include, among other things: changes in the prices and availability of aluminum (or premiums associated with such prices) or other materials and raw materials we use; the capacity and effectiveness of our metal hedging activities; relationships with, and financial and operating conditions of, our customers, suppliers and other stakeholders; fluctuations in the supply of, and prices for, energy in the areas in which we maintain production facilities; our ability to access financing for future capital requirements; changes in the relative values of various currencies and the effectiveness of our currency hedging activities; factors affecting our operations, such as litigation, environmental remediation and clean-up costs, labor relations and negotiations, breakdown of equipment and other events; the impact of restructuring efforts in the future; economic, regulatory and political factors within the countries in which we operate or sell our products, including changes in duties or tariffs; competition from other aluminum rolled products producers as well as from substitute materials such as steel, glass, plastic and composite materials; changes in general economic conditions including deterioration in the global economy, particularly sectors in which our customers operate; changes in the fair value of derivative instruments; cyclical demand and pricing within the principal markets for our products as well as seasonality in certain of our customers’ industries; changes in government regulations, particularly those affecting taxes, environmental, health or safety compliance; changes in interest rates that have the effect of increasing the amounts we pay under our principal credit agreement and other financing agreements; the effect of taxes and changes in tax rates; and our indebtedness and our ability to generate cash. The above list of factors is not exhaustive. Other important risk factors included under the caption "Risk Factors" in our Annual Report on Form 10-K for the fiscal year ended March 31, 2013 are specifically incorporated by reference into this presentation.
©2013Novelis Inc. 3 Agenda Business Review Novelis Strategy Detailed Financial Performance Summary & Outlook

©2013Novelis Inc. 4 Business Review
©2013Novelis Inc. 5 Second Quarter Highlights Global Shipments Up 1% Sequentially Record Auto Shipments Record Production in South America Lighter than Expected Can Demand in North America & Europe Positive Free Cash Flow Excellent Progress on Strategic Expansions Stable Performance Ahead of Stronger Second Half FY14 Solid Results in a Transitional Year
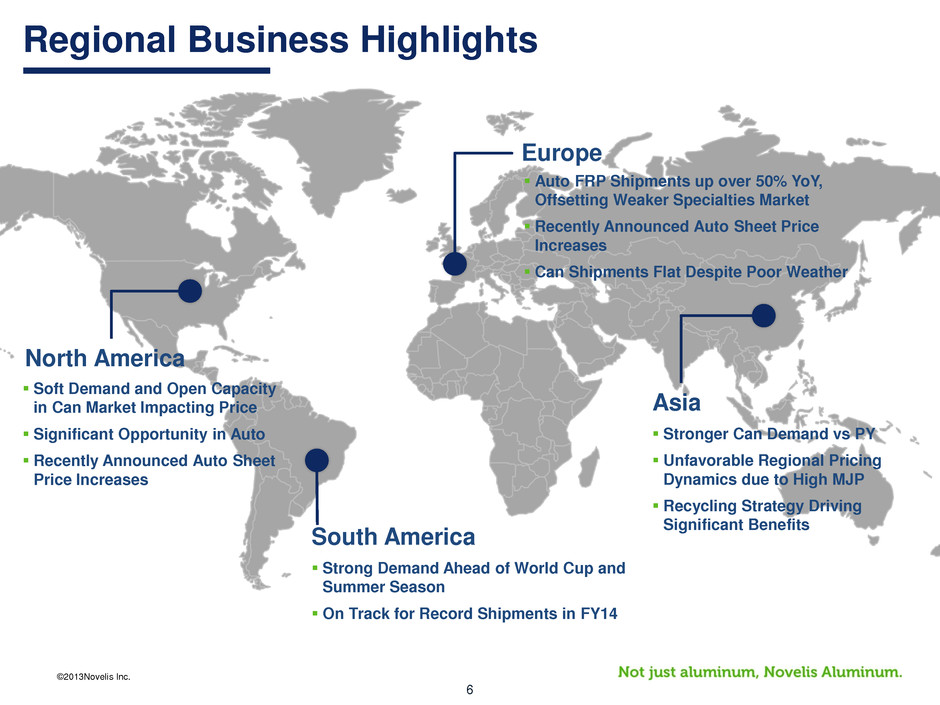
©2013Novelis Inc. 6 Regional Business Highlights Europe Auto FRP Shipments up over 50% YoY, Offsetting Weaker Specialties Market Recently Announced Auto Sheet Price Increases Can Shipments Flat Despite Poor Weather Asia North America South America Stronger Can Demand vs PY Unfavorable Regional Pricing Dynamics due to High MJP Recycling Strategy Driving Significant Benefits Soft Demand and Open Capacity in Can Market Impacting Price Significant Opportunity in Auto Recently Announced Auto Sheet Price Increases Strong Demand Ahead of World Cup and Summer Season On Track for Record Shipments in FY14
©2013Novelis Inc. 7 Novelis’ Strategy
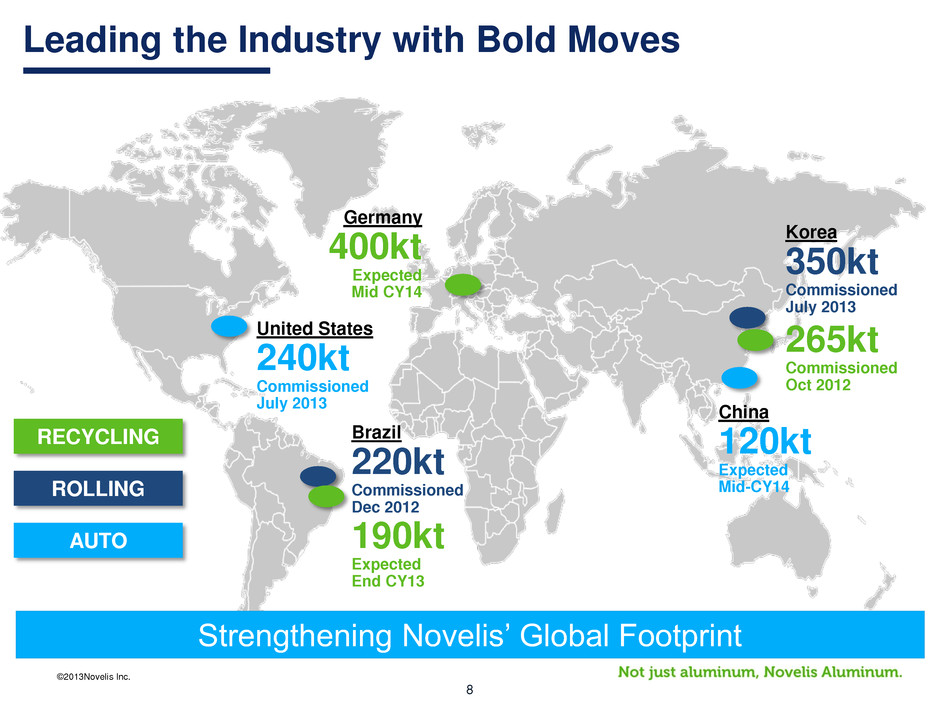
©2013Novelis Inc. 8 Leading the Industry with Bold Moves RECYCLING ROLLING AUTO REC CLING 190kt Expected End CY13 Germany 400kt Expected Mid CY14 265kt Commissioned Oct 2012 Brazil 220kt Commissioned Dec 2012 Korea 350kt Commissioned July 2013 United States 240kt Commissioned July 2013 China 120kt Expected Mid-CY14 Strengthening Novelis’ Global Footprint
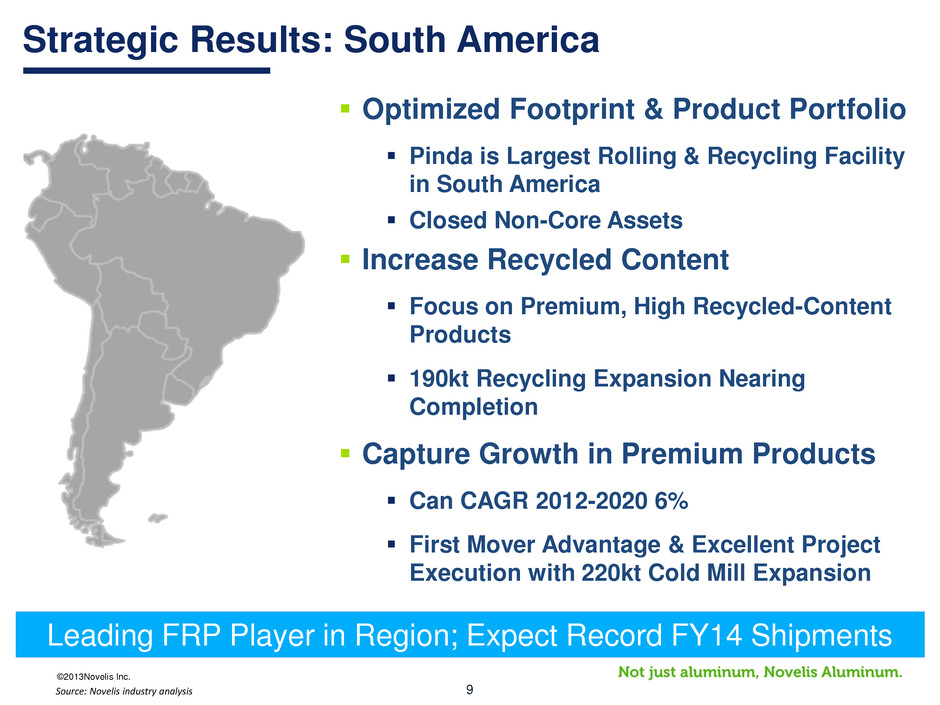
©2013Novelis Inc. 9 Strategic Results: South America Optimized Footprint & Product Portfolio Pinda is Largest Rolling & Recycling Facility in South America Closed Non-Core Assets Increase Recycled Content Focus on Premium, High Recycled-Content Products 190kt Recycling Expansion Nearing Completion Capture Growth in Premium Products Can CAGR 2012-2020 6% First Mover Advantage & Excellent Project Execution with 220kt Cold Mill Expansion Leading FRP Player in Region; Expect Record FY14 Shipments Source: Novelis industry analysis
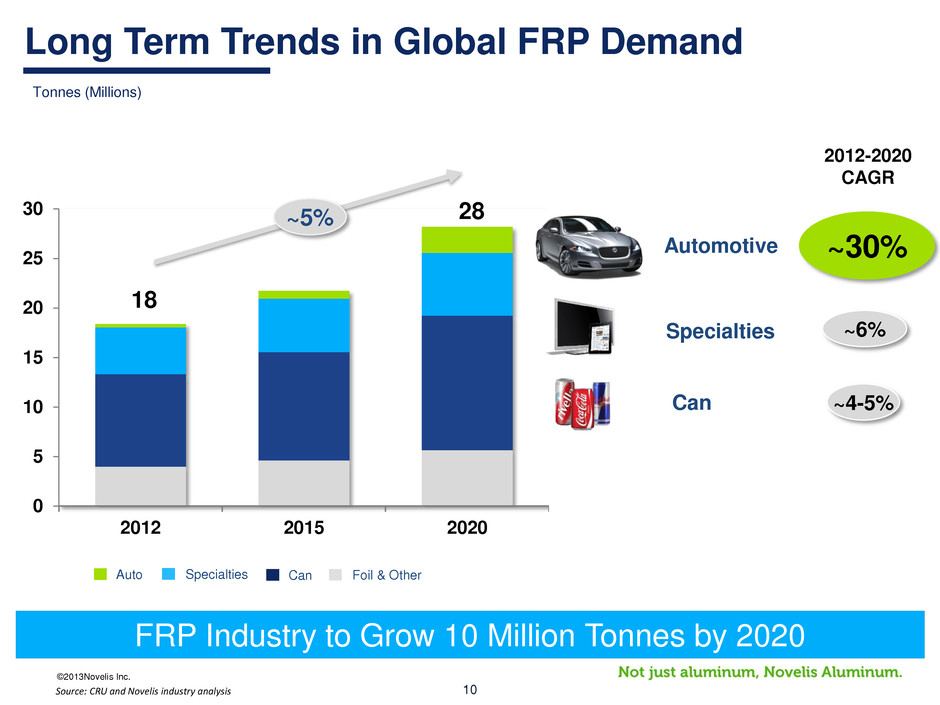
©2013Novelis Inc. 10 Long Term Trends in Global FRP Demand FRP Industry to Grow 10 Million Tonnes by 2020 ~30% Automotive ~4-5% Can 0 5 10 15 20 25 30 2012 2015 2020 ~5% ~6% Specialties 18 28 Source: CRU and Novelis industry analysis Tonnes (Millions) 2012-2020 CAGR Specialties Auto Foil & Other Can
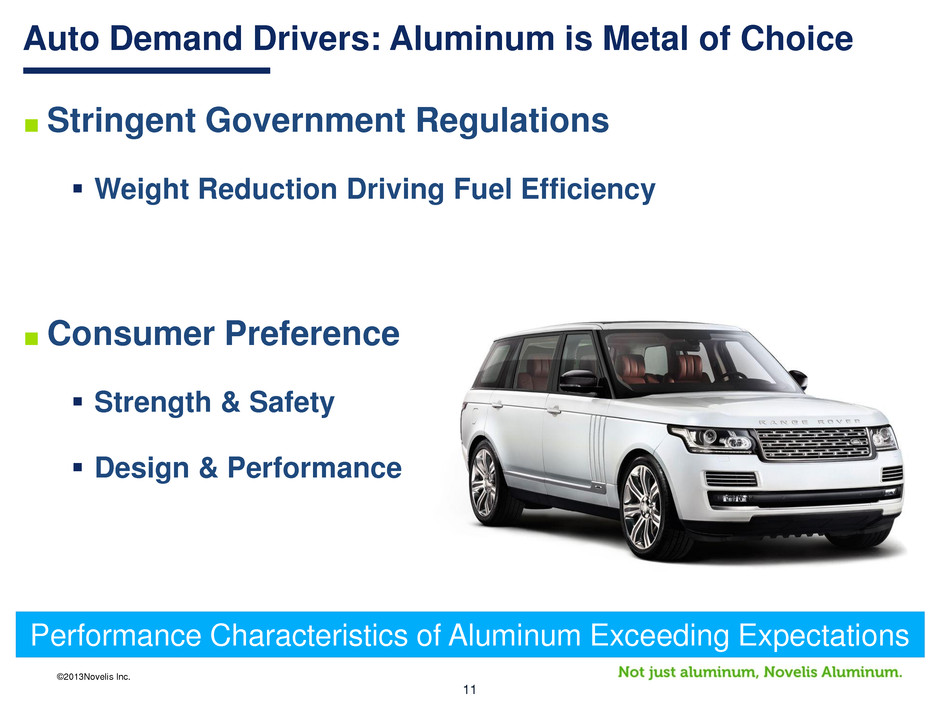
©2013Novelis Inc. 11 Auto Demand Drivers: Aluminum is Metal of Choice ■ Stringent Government Regulations Weight Reduction Driving Fuel Efficiency ■Consumer Preference Strength & Safety Design & Performance Performance Characteristics of Aluminum Exceeding Expectations
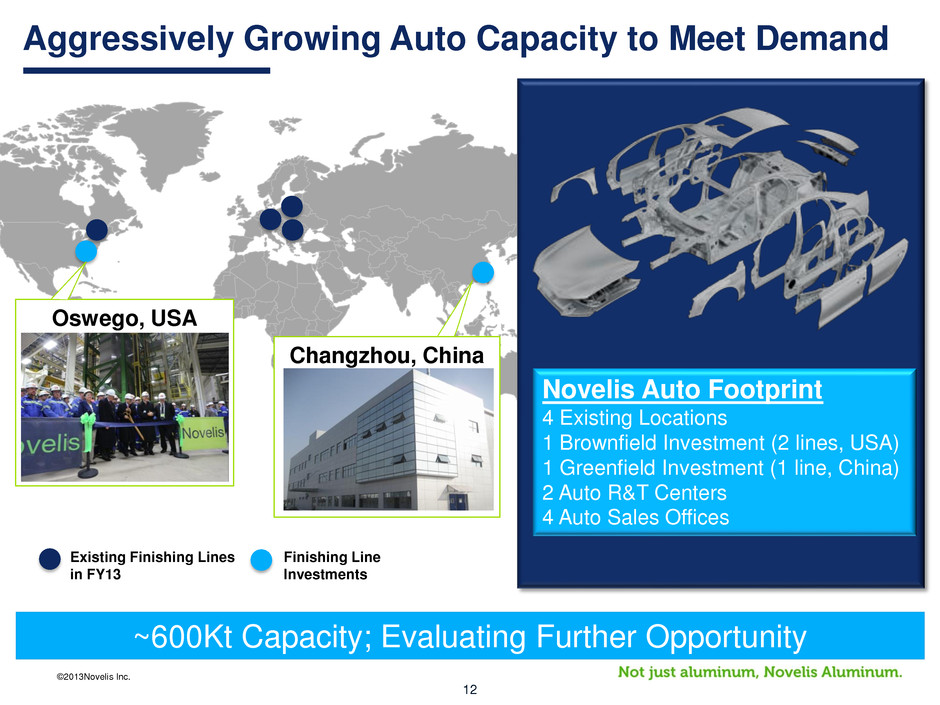
©2013Novelis Inc. 12 Oswego, USA Aggressively Growing Auto Capacity to Meet Demand Existing Finishing Lines in FY13 Finishing Line Investments ~600Kt Capacity; Evaluating Further Opportunity Changzhou, China Novelis Auto Footprint 4 Existing Locations 1 Brownfield Investment (2 lines, USA) 1 Greenfield Investment (1 line, China) 2 Auto R&T Centers 4 Auto Sales Offices
©2013Novelis Inc. 13 Why Is Novelis the Supplier of Choice? ■ First Mover Advantage ■ Global Footprint and Enhanced Recycling System ■ Investment in Technical Leadership ■ State of the Art Research & Technology Center Houses World’s Most Advanced Pilot Auto Pre-Treatment Line Novelis is the World Leader in Automotive FRP

©2013Novelis Inc. 14 Detailed Financial Performance
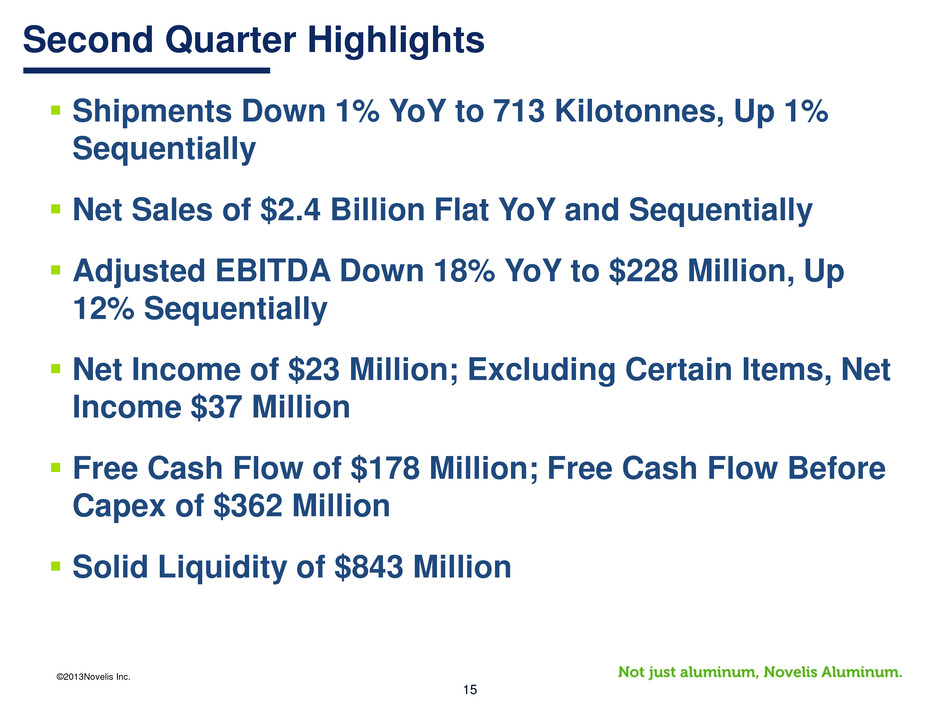
©2013Novelis Inc. 15 Second Quarter Highlights Shipments Down 1% YoY to 713 Kilotonnes, Up 1% Sequentially Net Sales of $2.4 Billion Flat YoY and Sequentially Adjusted EBITDA Down 18% YoY to $228 Million, Up 12% Sequentially Net Income of $23 Million; Excluding Certain Items, Net Income $37 Million Free Cash Flow of $178 Million; Free Cash Flow Before Capex of $362 Million Solid Liquidity of $843 Million
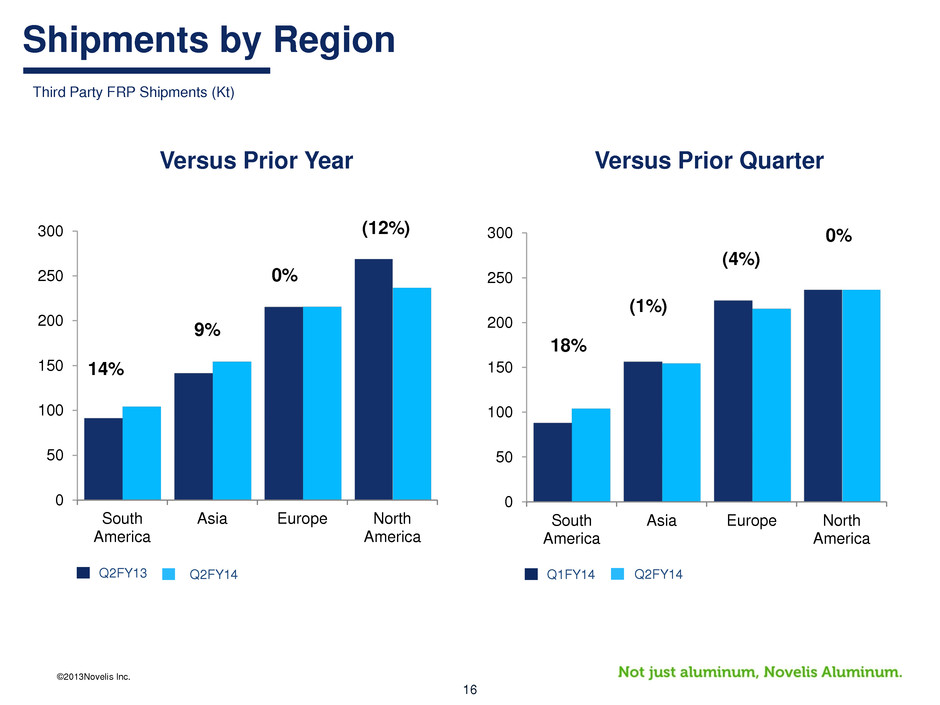
©2013Novelis Inc. 16 0 50 100 150 200 250 300 South America Asia Europe North America Q2FY14 Q1FY14 (1%) (4%) 0% 18% Third Party FRP Shipments (Kt) Shipments by Region Versus Prior Quarter 0 50 100 150 200 250 300 South America Asia Europe North America Versus Prior Year Q2FY14 Q2FY13 9% 0% (12%) 14%
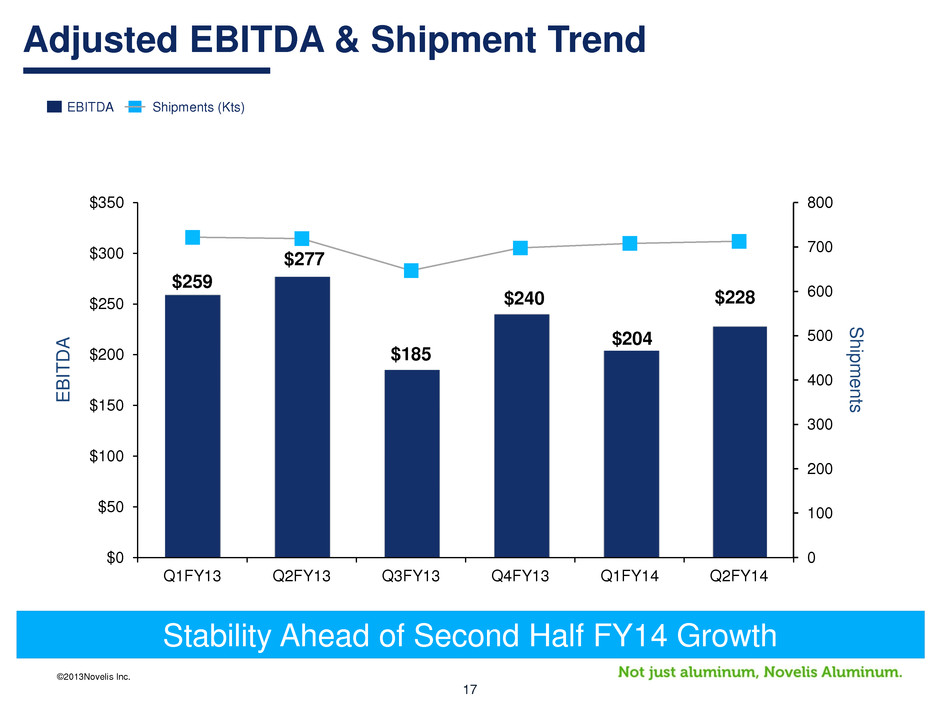
©2013Novelis Inc. 17 $259 $277 $185 $240 $204 $228 0 100 200 300 400 500 600 700 800 $0 $50 $100 $150 $200 $250 $300 $350 Q1FY13 Q2FY13 Q3FY13 Q4FY13 Q1FY14 Q2FY14 EB IT D A Ship m en ts EBITDA Adjusted EBITDA & Shipment Trend Stability Ahead of Second Half FY14 Growth Shipments (Kts)
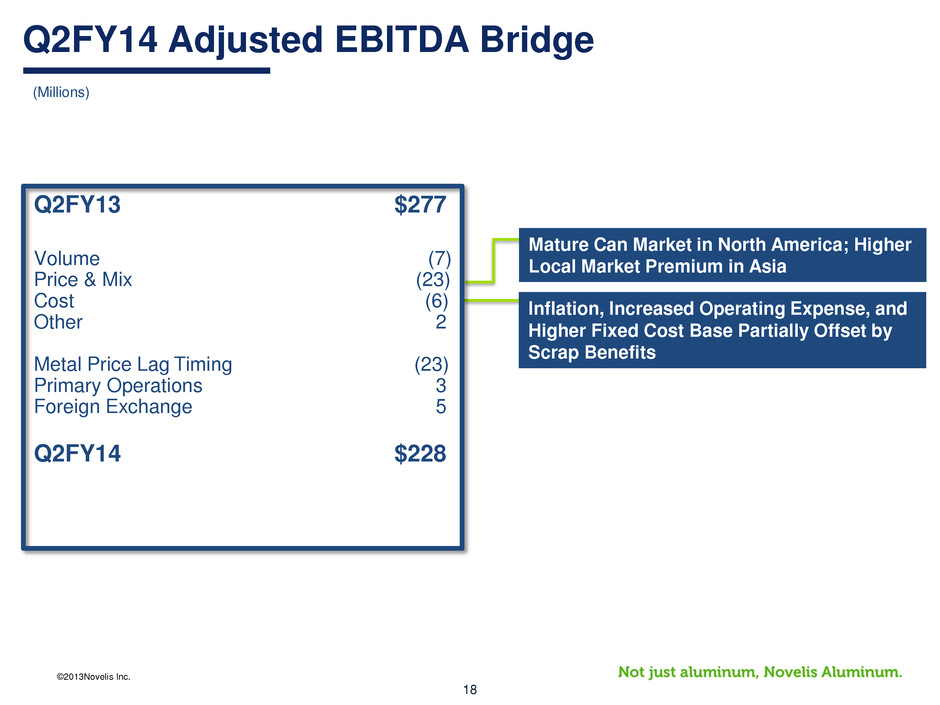
©2013Novelis Inc. 18 Q2FY14 Adjusted EBITDA Bridge (Millions) Q2FY13 $277 Volume (7) Price & Mix (23) Cost (6) Other 2 Metal Price Lag Timing (23) Primary Operations 3 Foreign Exchange 5 Q2FY14 $228 Mature Can Market in North America; Higher Local Market Premium in Asia Inflation, Increased Operating Expense, and Higher Fixed Cost Base Partially Offset by Scrap Benefits
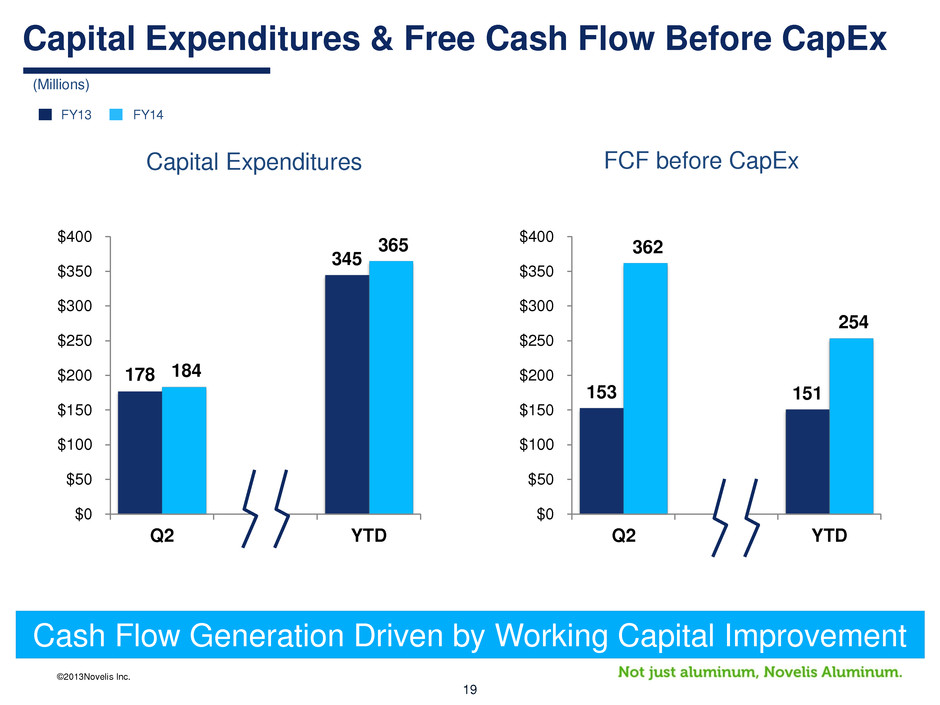
©2013Novelis Inc. 19 (Millions) Capital Expenditures & Free Cash Flow Before CapEx FY14 FY13 153 151 362 254 $0 $50 $100 $150 $200 $250 $300 $350 $400 Q2 YTD 178 345 184 365 $0 $50 $100 $150 $200 $250 $300 $350 $400 Q2 YTD Capital Expenditures FCF before CapEx Cash Flow Generation Driven by Working Capital Improvement

©2013Novelis Inc. 20 Summary & Outlook
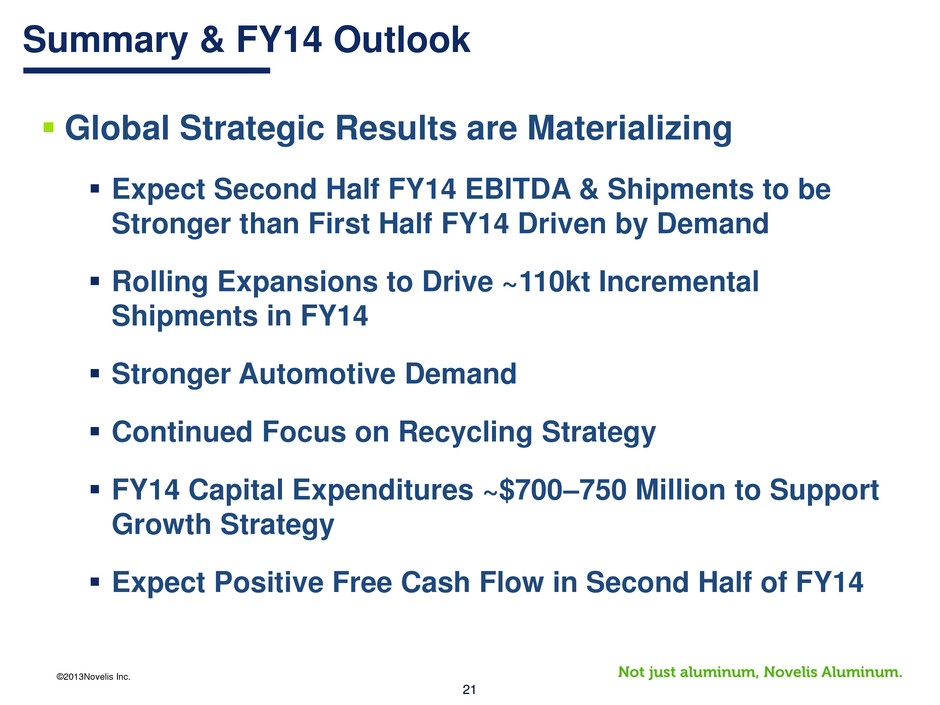
©2013Novelis Inc. 21 Summary & FY14 Outlook Global Strategic Results are Materializing Expect Second Half FY14 EBITDA & Shipments to be Stronger than First Half FY14 Driven by Demand Rolling Expansions to Drive ~110kt Incremental Shipments in FY14 Stronger Automotive Demand Continued Focus on Recycling Strategy FY14 Capital Expenditures ~$700–750 Million to Support Growth Strategy Expect Positive Free Cash Flow in Second Half of FY14

©2013Novelis Inc. 22 Questions & Answers

©2013Novelis Inc. 23 Appendix
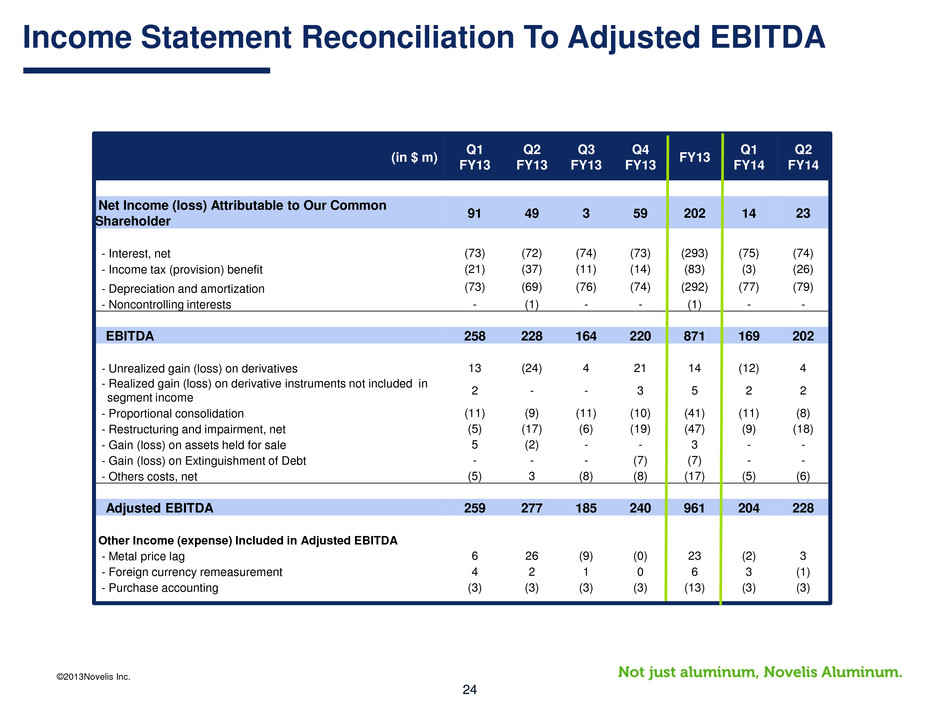
©2013Novelis Inc. 24 (in $ m) Q1 FY13 Q2 FY13 Q3 FY13 Q4 FY13 FY13 Q1 FY14 Q2 FY14 Net Income (loss) Attributable to Our Common Shareholder 91 49 3 59 202 14 23 - Interest, net (73) (72) (74) (73) (293) (75) (74) - Income tax (provision) benefit (21) (37) (11) (14) (83) (3) (26) - Depreciation and amortization (73) (69) (76) (74) (292) (77) (79) - Noncontrolling interests - (1) - - (1) - - EBITDA 258 228 164 220 871 169 202 - Unrealized gain (loss) on derivatives 13 (24) 4 21 14 (12) 4 - Realized gain (loss) on derivative instruments not included in segment income 2 - - 3 5 2 2 - Proportional consolidation (11) (9) (11) (10) (41) (11) (8) - Restructuring and impairment, net (5) (17) (6) (19) (47) (9) (18) - Gain (loss) on assets held for sale 5 (2) - - 3 - - - Gain (loss) on Extinguishment of Debt - - - (7) (7) - - - Others costs, net (5) 3 (8) (8) (17) (5) (6) Adjusted EBITDA 259 277 185 240 961 204 228 Other Income (expense) Included in Adjusted EBITDA - Metal price lag 6 26 (9) (0) 23 (2) 3 - Foreign currency remeasurement 4 2 1 0 6 3 (1) - Purchase accounting (3) (3) (3) (3) (13) (3) (3) Income Statement Reconciliation To Adjusted EBITDA
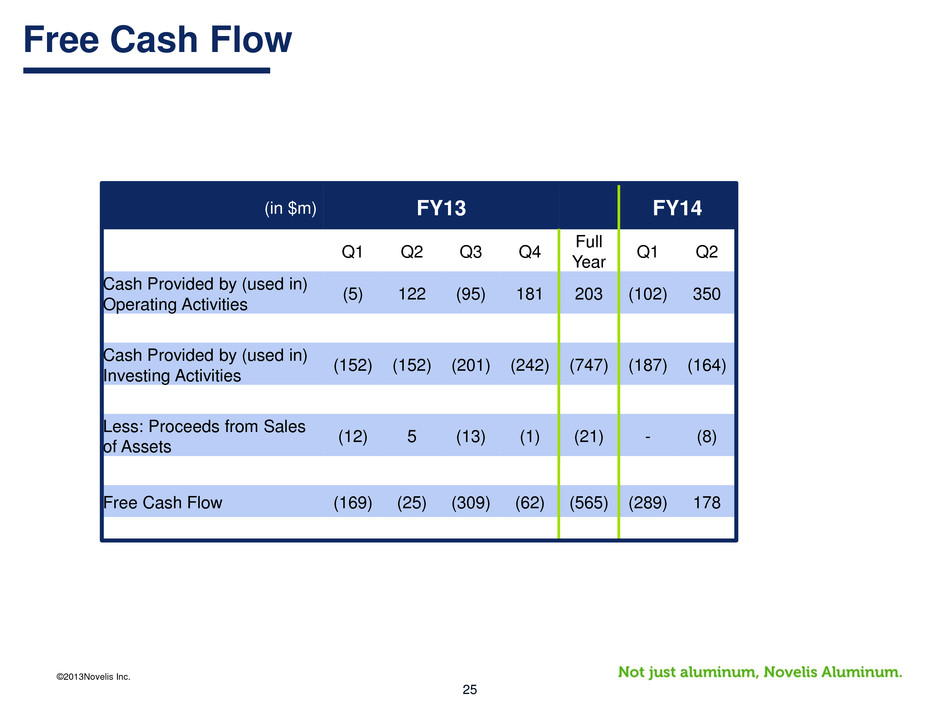
©2013Novelis Inc. 25 (in $m) FY13 FY14 Q1 Q2 Q3 Q4 Full Year Q1 Q2 Cash Provided by (used in) Operating Activities (5) 122 (95) 181 203 (102) 350 Cash Provided by (used in) Investing Activities (152) (152) (201) (242) (747) (187) (164) Less: Proceeds from Sales of Assets (12) 5 (13) (1) (21) - (8) Free Cash Flow (169) (25) (309) (62) (565) (289) 178 Free Cash Flow
©2013Novelis Inc. 26 1) Metal Price Lag Net of Related Hedges: On certain sales contracts we experience timing differences on the pass through of changing aluminum prices from our suppliers to our customers. Additional timing differences occur in the flow of metal costs through moving average inventory cost values and cost of goods sold. This timing difference is referred to as Metal Price Lag. We have a risk management program in place to minimize the impact of this “lag”. 2) Foreign Currency Remeasurement Net of Related Hedges: All Balance Sheet accounts not denominated in functional currency are remeasured every period to the period end exchange rates. This impacts our profitability. Like Metal Price Lag, we have a risk management program in place to minimize the impact of such remeasurement. 3) Purchase Accounting: Following our acquisition, the consideration and transaction costs paid by Hindalco in connection with the transaction were “pushed down” to us and were allocated to the assets acquired and the liabilities assumed. These allocations are amortized over periods, impacting our profitability. Explanation of Other Income (Expense) in Adjusted EBITDA
©2013Novelis Inc. 27 Non-GAAP Financial Measures This presentation contains the following non-GAAP financial measures: Adjusted EBITDA, Free Cash Flow, Free Cash Flow Before CapEx, Net Income (Loss) Excluding Certain Items and Liquidity. We think that these measures are helpful to investors in measuring our financial performance and liquidity and comparing our performance to our peers. However, our non-GAAP financial measures may not be comparable to similarly titled non- GAAP financial measures used by other companies. These non-GAAP financial measures have limitations as an analytical tool and should not be considered in isolation or as a substitute for GAAP financial measures. We have included reconciliations of each of these measures to the most directly comparable GAAP measure. In addition, a more detailed description of these non-GAAP financial measures used in this presentation, together with a discussion of the usefulness and purpose of such measures, is included below. EBITDA and Adjusted EBITDA. EBITDA consists of earnings before interest, taxes, depreciation and amortization. Adjusted EBITDA further adjusts EBITDA for unrealized (gains) losses on change in fair value of certain derivative instruments, impairment of goodwill, impairment charges on long- lived assets, gains (losses) on extinguishment of debt, adjustment to include proportional consolidation, restructuring charges, and gains or losses on disposals of property, plant and equipment and businesses and certain other costs. EBITDA and Adjusted EBITDA are measures commonly used in the company’s industry, and the company presents EBITDA and Adjusted EBITDA to enhance investors’ understanding of the company’s operating performance. Novelis believes that EBITDA and Adjusted EBITDA are operating performance measures, and not liquidity measures, that provide investors and analysts with a measure of operating results unaffected by differences in capital structures, capital investment cycles and ages of related assets among otherwise comparable companies. However, EBITDA and Adjusted EBITDA: •do not reflect the company’s cash expenditures or requirements for capital expenditures or capital commitments; •do not reflect changes in, or cash requirements for, the company’s working capital needs; and •do not reflect any costs related to the current or future replacement of assets being depreciated and amortized. Management believes that investors’ understanding of the company’s performance is enhanced by including these non-GAAP financial measures as a reasonable basis for comparing the company’s ongoing results of operations. Many investors are interested in understanding the performance of the company’s business by comparing its results from ongoing operations from one period to the next and would ordinarily add back items that are not part of normal day-to-day operations of the company’s business. By providing these non-GAAP financial measures, together with reconciliations, the company believes it is enhancing investors’ understanding of its business and its results of operations, as well as assisting investors in evaluating how well it is executing strategic initiatives. Additionally, a form of adjusted EBITDA, defined in the company’s senior secured credit facilities, 8.375% senior notes and 8.75% senior notes, is used for debt covenant compliance purposes, which has additional adjustments to Adjusted EBITDA which may decrease or increase adjusted EBITDA for purposes of these financial covenants. The company also uses EBITDA and Adjusted EBITDA: •as measures of operating performance to assist the company in comparing its operating performance on a consistent basis because it removes the impact of items not directly resulting from the company’s core operations; •for planning purposes, including the preparation of the company’s internal annual operating budgets and financial projections; •to evaluate the performance and effectiveness of the company operational strategies; and •to calculate incentive compensation payments for the company’s key employees.
©2013Novelis Inc. 28 Non-GAAP Financial Measures Free Cash Flow and Free Cash Flow Before CapEx. Free Cash Flow consists of: (a) net cash provided by (used in) operating activities; (b) plus net cash provided by (used in) investing activities and (c) less proceeds from sales of assets. Free Cash Flow before Cap Ex consists of: (a) Free Cash Flow, plus (b) capital expenditures. Management believes that Free Cash Flow and Free Cash Flow Before CapEx are relevant to investors as they provide a measure of the cash generated internally that is available for debt service and other value creation opportunities. However, Free Cash Flow and Free Cash Flow Before CapEx are not measurements of financial performance or liquidity under GAAP and does not necessarily represent cash available for discretionary activities, as certain debt service obligations must be funded out of Free Cash Flow. In addition, the company's method of calculating Free Cash Flow and Free Cash Flow Before CapEx may not be consistent with that of other companies. Net Income (Loss) Excluding Certain Items. Net Income (Loss) Excluding Certain Items adjusts net income (loss) for restructuring charges, gains (losses) on sale of assets held for sale, and the tax effect of such items. We adjust for items which may recur in varying magnitude which affect the comparability of the operational results of our underlying business. Novelis believes that Net Income (Loss) Excluding Certain Items enhances the overall understanding of the company's current financial performance. Specifically, management believes this non-GAAP financial measure provides useful information to investors by excluding or adjusting certain items, which impact the comparability of the company's core operating results. With respect to gains (losses) on sale of assets held for sale, and the tax effect of such certain items, management believes these excluded items are not reflective of fixed costs that the company believes it will incur over the long term. Management also adjusts for restructuring charges to enhance the comparability of the company’s operating results between periods. However, the company has recorded similar charges in prior periods. The company will incur additional restructuring charges in connection with ongoing restructuring initiatives announced previously and may also incur additional restructuring charges in connection with future streamlining measures. Net Income (Loss) Excluding Certain Items should be considered in addition to, and not as a substitute for or superior to, results prepared in accordance with GAAP. Liquidity. Liquidity consists of cash and cash equivalents plus availability under our committed credit facilities. In addition to presenting available cash and cash equivalents, management believes that presenting Liquidity enhances investors’ understanding of the liquidity that is actually available to the company. This financial measure should be considered in addition to, and not as a substitute for or superior to, results prepared in accordance with GAAP.